Fig. 8.
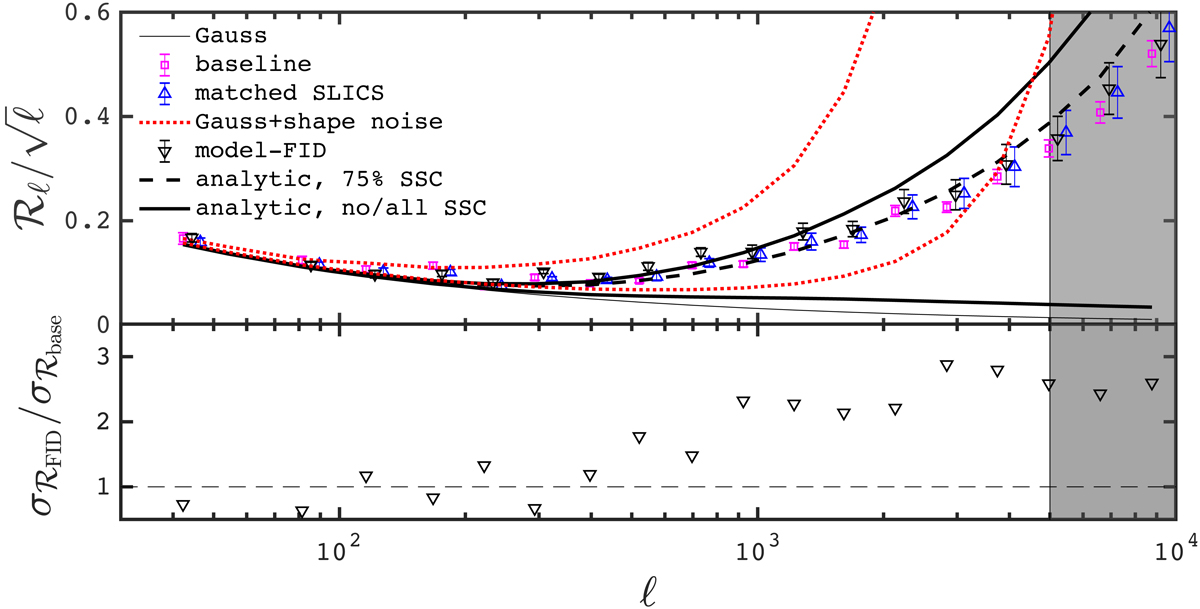
Upper: ratio between the diagonal of the lensing power spectrum covariance matrices and the noise-free Gaussian term (i.e. Eq. (15)). We further divide this ratio by ![]() to increase the readability of the low-ℓ part. The magenta squares correspond to the “baseline” measurement estimated from 800 independent light-cones with error bars from bootstrap resamplings. The blue upward pointing triangles show the results from multiple ray-tracing the 14 matched-pairs found in the SLICS, while the black downward triangles are from the cosmo-SLICS (see main text in Sect. 4.1 for more details). The error bars on the two sets of triangles are estimated from the scatter over the 14 matched SLICS pairs. Horizontal positions are offset for clarity. The thick solid and dashed lines represent the analytic calculations with 0, 75 and 100% of the SSC term (see Eq. (4)). The red dotted-lines show the Gaussian term only, but this time with shot noise included assuming either KiDS (left) or LSST (right) survey configuration described in Table 3. Lower: ratio between the error on ℛℓ estimated from the cosmo-SLICS and from the baseline methods.
to increase the readability of the low-ℓ part. The magenta squares correspond to the “baseline” measurement estimated from 800 independent light-cones with error bars from bootstrap resamplings. The blue upward pointing triangles show the results from multiple ray-tracing the 14 matched-pairs found in the SLICS, while the black downward triangles are from the cosmo-SLICS (see main text in Sect. 4.1 for more details). The error bars on the two sets of triangles are estimated from the scatter over the 14 matched SLICS pairs. Horizontal positions are offset for clarity. The thick solid and dashed lines represent the analytic calculations with 0, 75 and 100% of the SSC term (see Eq. (4)). The red dotted-lines show the Gaussian term only, but this time with shot noise included assuming either KiDS (left) or LSST (right) survey configuration described in Table 3. Lower: ratio between the error on ℛℓ estimated from the cosmo-SLICS and from the baseline methods.
Current usage metrics show cumulative count of Article Views (full-text article views including HTML views, PDF and ePub downloads, according to the available data) and Abstracts Views on Vision4Press platform.
Data correspond to usage on the plateform after 2015. The current usage metrics is available 48-96 hours after online publication and is updated daily on week days.
Initial download of the metrics may take a while.