Fig. 7.
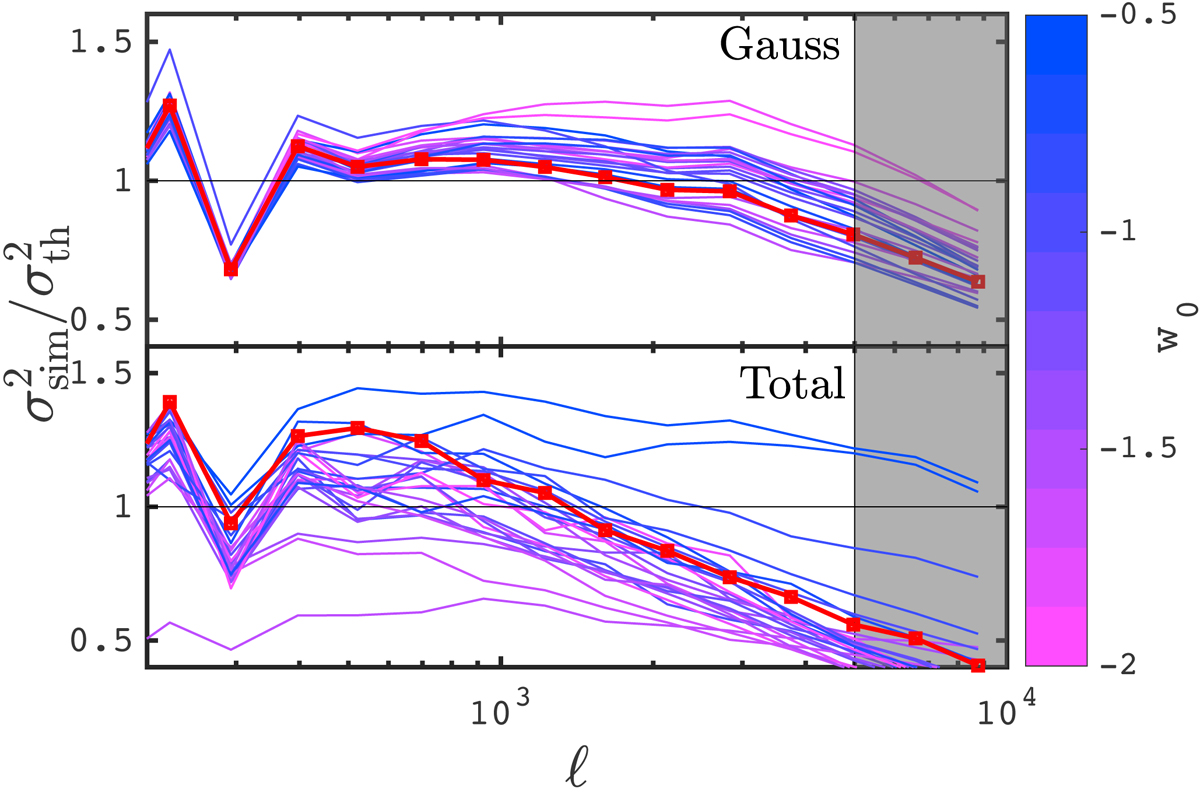
Ratio between the variance of the shape noise-free lensing power spectrum estimated from the cosmo-SLICS simulations and that obtained from the analytical calculations. The upper panel is for the Gaussian ![]() term only, while the lower panel shows our results for the full
term only, while the lower panel shows our results for the full ![]() estimates. The lines are colour-coded as a function of w0, ranging from magenta (w0 ∼ −2) to blue (w0 ∼ −0.5), with the fiducial model shown in red squares. Models with high (low) w0 exhibit larger (smaller) ratios.
estimates. The lines are colour-coded as a function of w0, ranging from magenta (w0 ∼ −2) to blue (w0 ∼ −0.5), with the fiducial model shown in red squares. Models with high (low) w0 exhibit larger (smaller) ratios.
Current usage metrics show cumulative count of Article Views (full-text article views including HTML views, PDF and ePub downloads, according to the available data) and Abstracts Views on Vision4Press platform.
Data correspond to usage on the plateform after 2015. The current usage metrics is available 48-96 hours after online publication and is updated daily on week days.
Initial download of the metrics may take a while.