Fig. C.2.
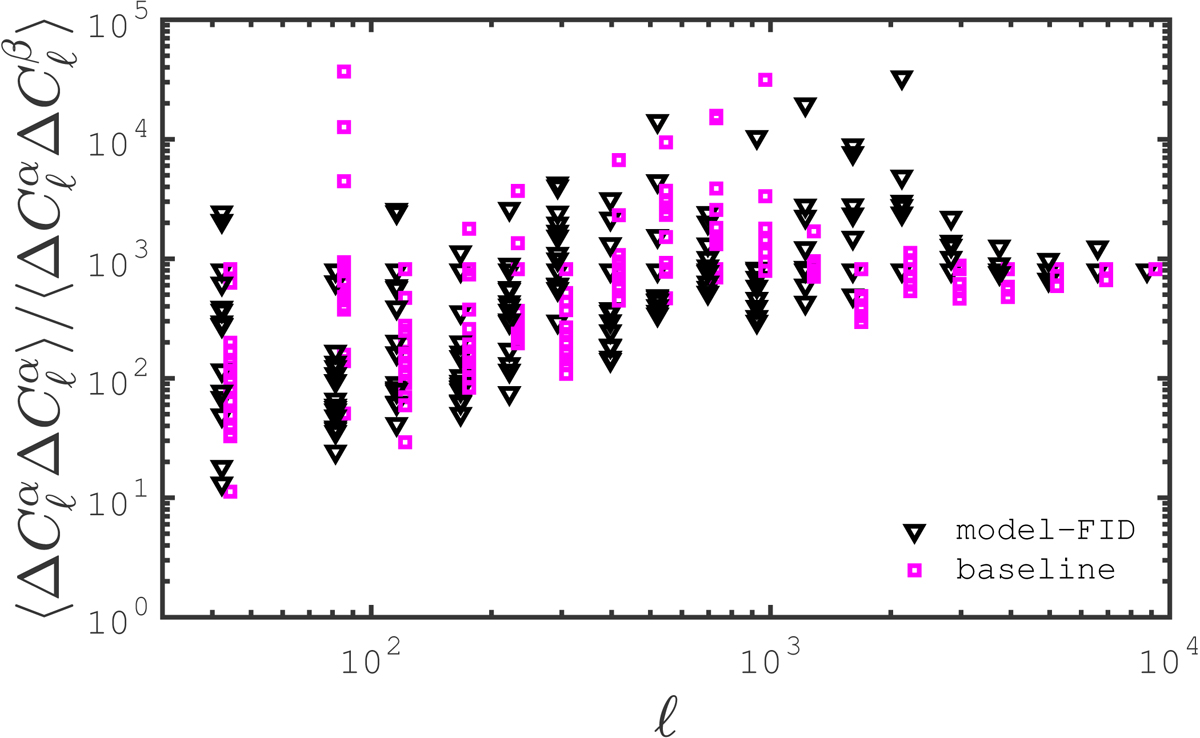
Ratio between the elements of the standard covariance matrix, ![]() , and those from the “cross-sample” covariance,
, and those from the “cross-sample” covariance, ![]() , where α, β label individual light-cones, and α ≠ β. These matrices contain 182 elements, hence for every ℓ-mode we plot the 18 ℓ′ components of the baseline (in magenta squares, offset for clarity) and model-FID estimator (in black triangles).
, where α, β label individual light-cones, and α ≠ β. These matrices contain 182 elements, hence for every ℓ-mode we plot the 18 ℓ′ components of the baseline (in magenta squares, offset for clarity) and model-FID estimator (in black triangles).
Current usage metrics show cumulative count of Article Views (full-text article views including HTML views, PDF and ePub downloads, according to the available data) and Abstracts Views on Vision4Press platform.
Data correspond to usage on the plateform after 2015. The current usage metrics is available 48-96 hours after online publication and is updated daily on week days.
Initial download of the metrics may take a while.