Fig. B.3.
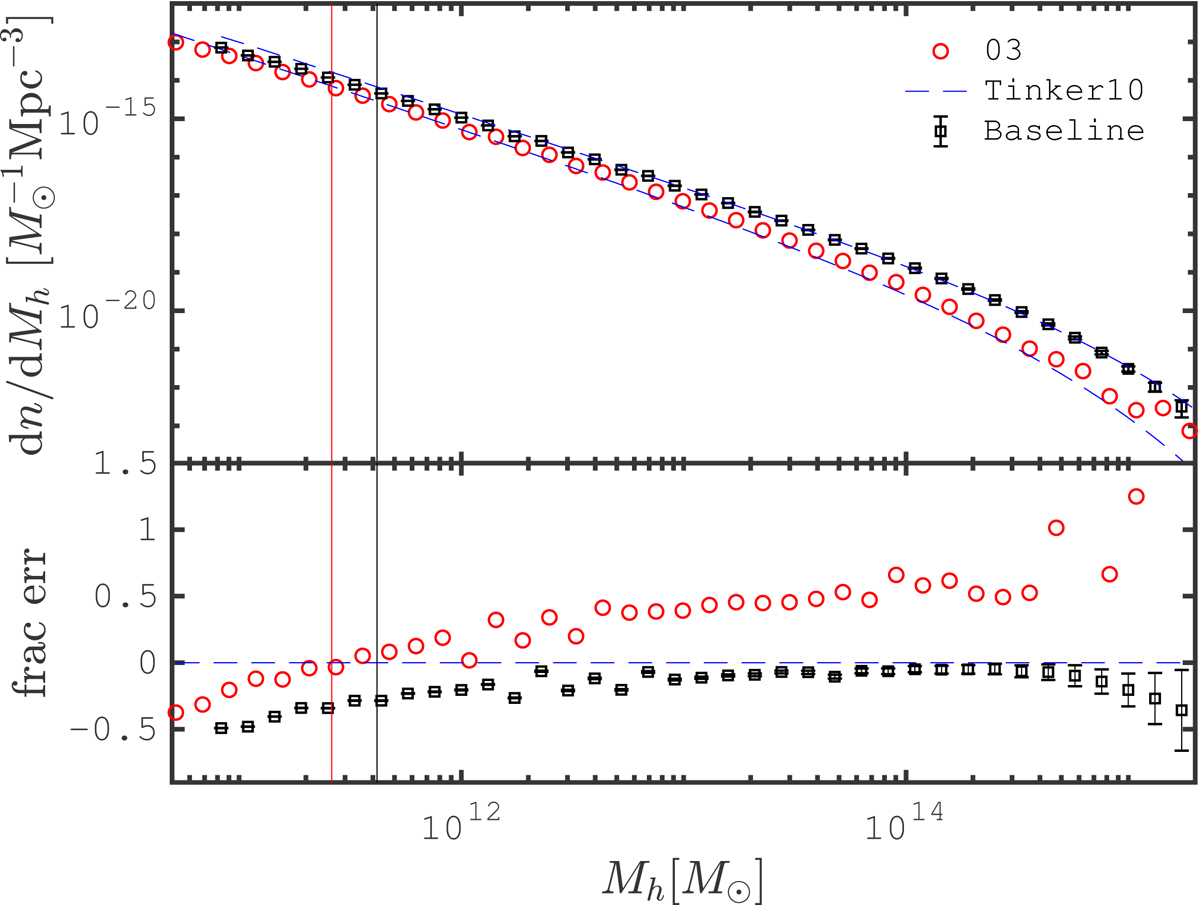
Comparison between the halo mass function measured from the simulations (symbols) and the fit function from Tinker et al. (2010, shown with the blue dashed lines). The red circles present the measurements from model-03 at redshift z = 0.043, while the black squares are from the SLICS simulations (hence the error bars). Lower panel: fractional error between simulations and models, where the latter is taken as the reference. The vertical lines mark the mass of dark matter haloes containing 100 particles, which varies between cosmologies due to changes in the particle mass.
Current usage metrics show cumulative count of Article Views (full-text article views including HTML views, PDF and ePub downloads, according to the available data) and Abstracts Views on Vision4Press platform.
Data correspond to usage on the plateform after 2015. The current usage metrics is available 48-96 hours after online publication and is updated daily on week days.
Initial download of the metrics may take a while.