Fig. 2.
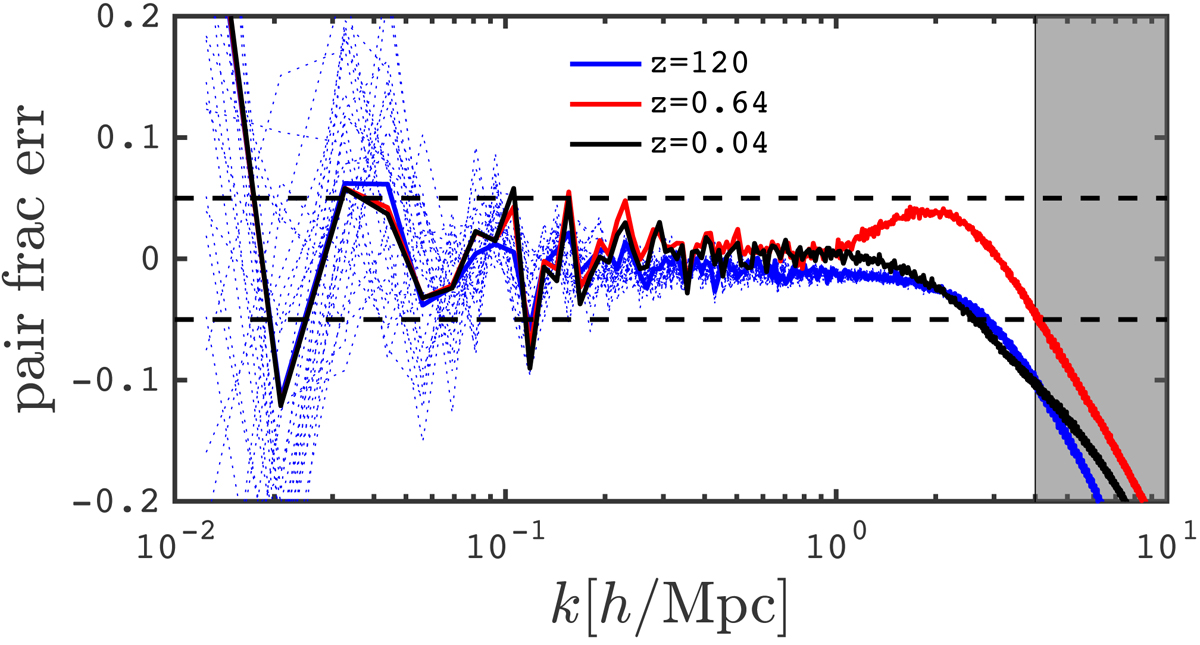
Fractional difference between the mean of simulation pairs at the fiducial cosmology (i.e. model-FID) and the input theoretical model P(k), obtained with HALOFIT. Faint blue dotted lines show the results for a number of random pairs at the initial redshift zi = 120, while the thick blue line highlights the best pair. The sampling variance cancels to better than 5% also at z = 0.64 and 0.04, as demonstrated respectively by the red and black lines. The grey zone indicates the regime where the discrepancy exceeds 10%.
Current usage metrics show cumulative count of Article Views (full-text article views including HTML views, PDF and ePub downloads, according to the available data) and Abstracts Views on Vision4Press platform.
Data correspond to usage on the plateform after 2015. The current usage metrics is available 48-96 hours after online publication and is updated daily on week days.
Initial download of the metrics may take a while.