Fig. 8.
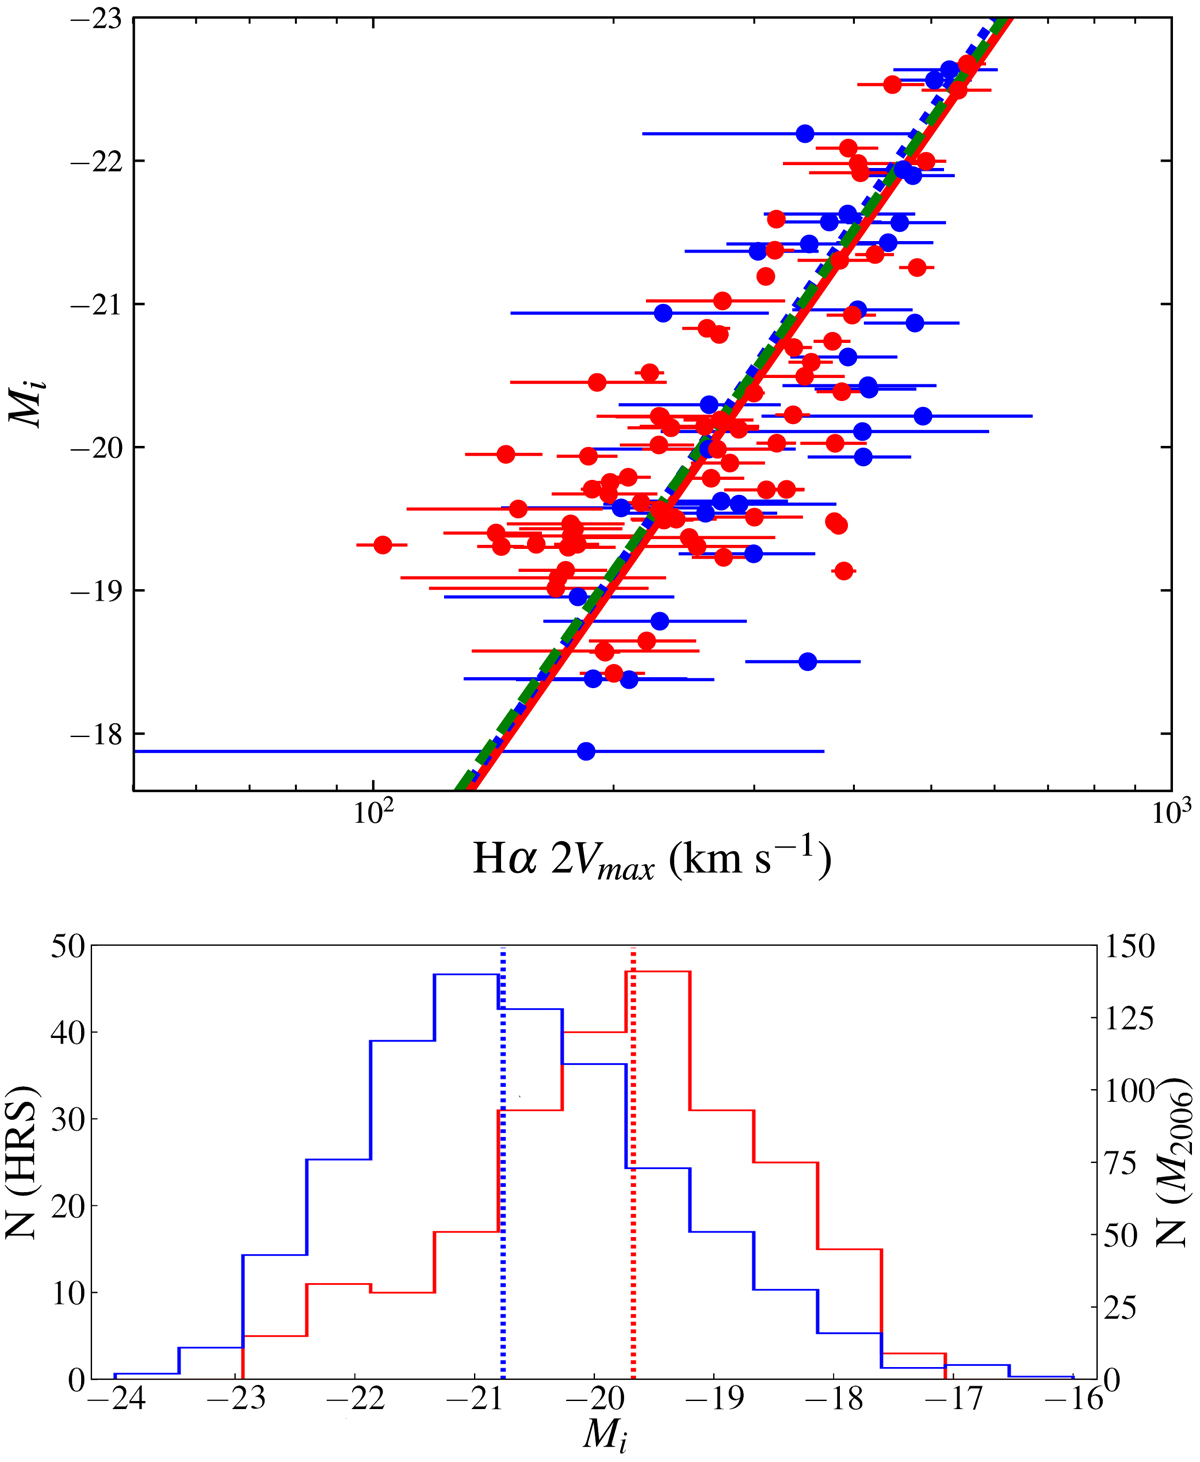
Top panel: i-band Tully–Fisher relation. Red and blue dots indicate HRS galaxies with Hα and H I kinematical data. The solid red line indicates the OLS bisector regression to the HRS data. The dotted blue line represents the template I-band TF relation for the nearby galaxy sample of Masters et al. (2006) but using an OSL bisector method (instead of the bivariate method used by those authors). The dashed green line represents the median OSL bisector fit computed from the 100 subsamples of 135 galaxies matching our galaxy luminosity distribution, randomly selected from the Masters et al. (2006) sample. Bottom panel: Mi distributions of the HRS (red) and the Masters et al. (2006) samples M2006 (blue); dotted lines indicate the median value of the corresponding distribution (HRS = −19.67, M2006 = −20.76).
Current usage metrics show cumulative count of Article Views (full-text article views including HTML views, PDF and ePub downloads, according to the available data) and Abstracts Views on Vision4Press platform.
Data correspond to usage on the plateform after 2015. The current usage metrics is available 48-96 hours after online publication and is updated daily on week days.
Initial download of the metrics may take a while.