Fig. 4.
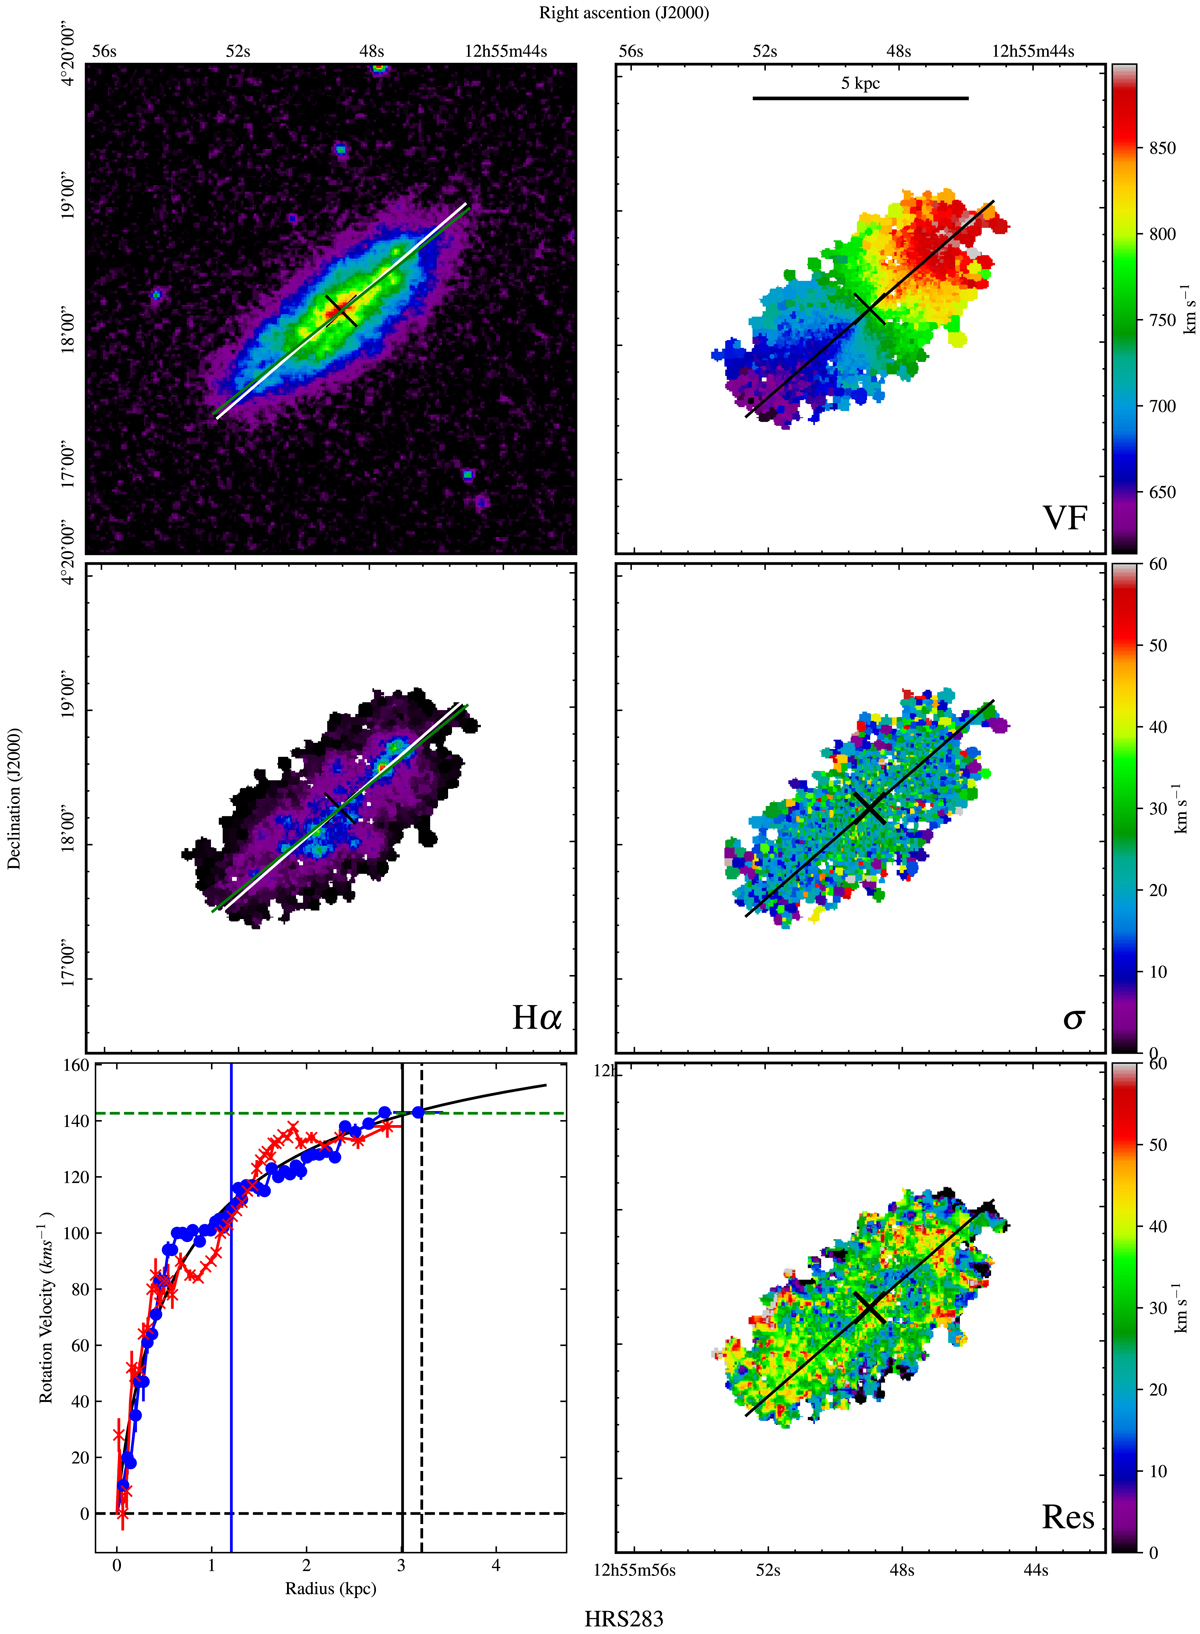
Example of the products derived from Fabry–Perot observations. Top left: XDSS R-band image. Top right: Hα velocity field. Middle left: Hα monochromatic image. Middle right: Hα velocity dispersion field. Bottom left: rotation curve. Bottom right: residual velocity field. The black cross is the kinematical center. In the maps, the green line is the morphological major axis, while the black/white line is the estimated kinematical major axis, its length represents the 2 × ropt. On the rotation curve, blue dots indicate the approaching side while red crosses the receding side, the black solid vertical line represents the ropt, and the black dashed line represents the r25; the blue solid line the reff and the green horizontal line the H IVmax; the solid black curve is the Courteau function best fit to the rotation curve. The maps and plots for the all the galaxies of the HRS are available at the CDS, on the HRS dedicated database HeDAM (https://hedam.lam.fr/), and on the Fabry–Perot database (https://cesam.lam.fr/fabryperot).
Current usage metrics show cumulative count of Article Views (full-text article views including HTML views, PDF and ePub downloads, according to the available data) and Abstracts Views on Vision4Press platform.
Data correspond to usage on the plateform after 2015. The current usage metrics is available 48-96 hours after online publication and is updated daily on week days.
Initial download of the metrics may take a while.