Fig. 2.
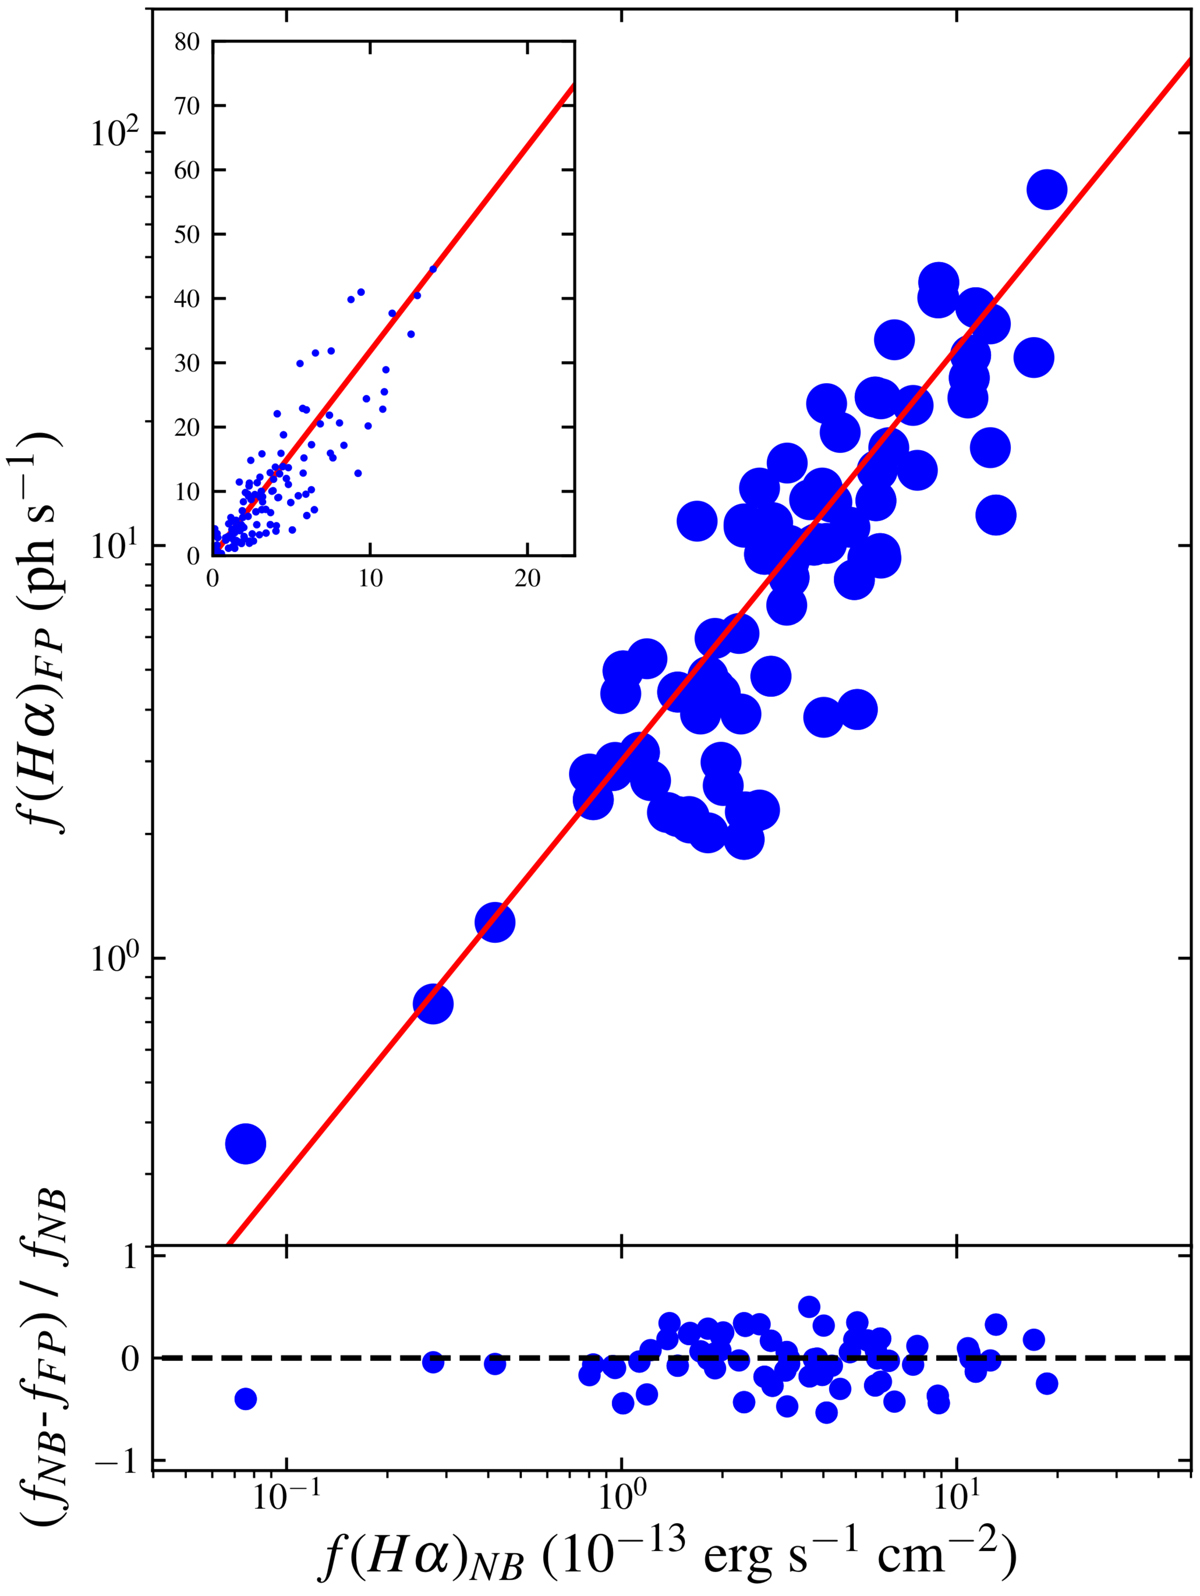
Top panel (and top-left insert): Hα integrated fluxes measured by GHASP compared with Hα integrated fluxes from Boselli et al. (2015); the solid red line represents the OLS bisector linear regression on the data from which results our calibration; the insert at the top-left shows the same calibration plot but using a linear scale. Bottom panel: normalised residual values, where fNB are fluxes from Boselli et al. (2015) and fFP are GHASP calibrated fluxes.
Current usage metrics show cumulative count of Article Views (full-text article views including HTML views, PDF and ePub downloads, according to the available data) and Abstracts Views on Vision4Press platform.
Data correspond to usage on the plateform after 2015. The current usage metrics is available 48-96 hours after online publication and is updated daily on week days.
Initial download of the metrics may take a while.