Fig. 6
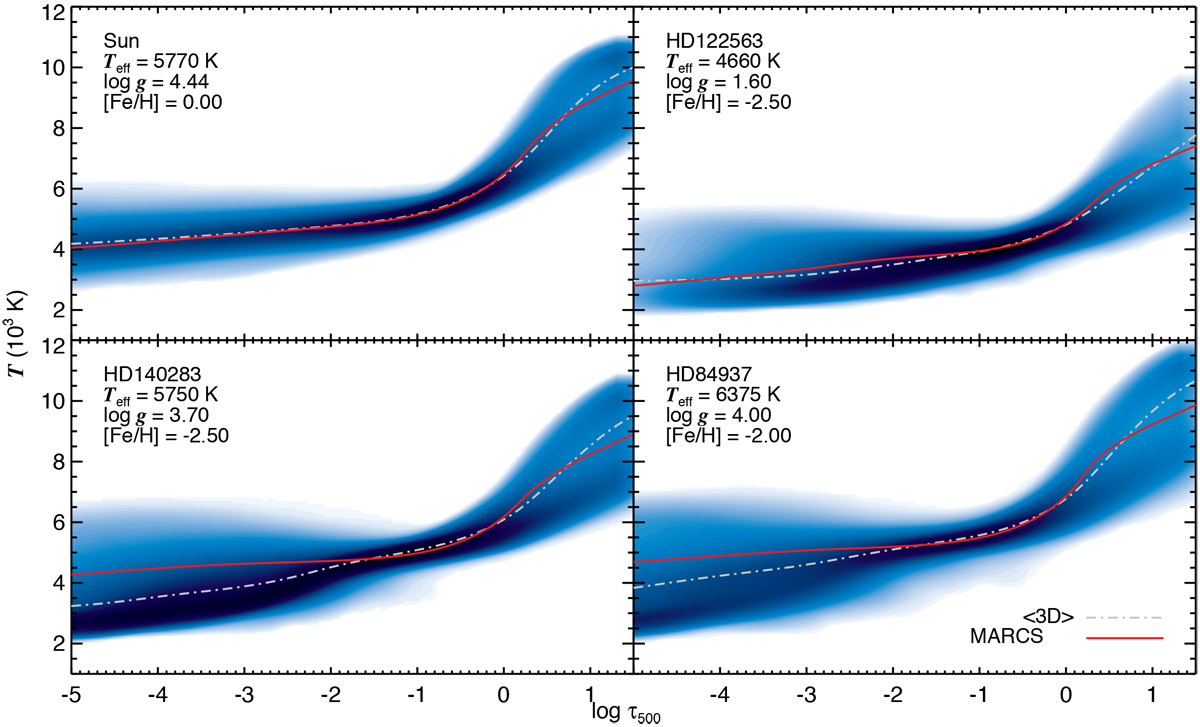
3D, 1D, and ⟨3D⟩ temperature structures as a function of Rosseland optical depth for benchmark stars. The blue-shaded regions indicate the kinetic temperature distributions in the representative snapshot from the 3D convection simulations. The stellar parameters are given in the inset. We note that ⟨3D ⟩ models are provided only to illustrate the difference between the average structure of the 1D and 3D models, however, the ⟨3D ⟩ are not used in our abundance analysis.
Current usage metrics show cumulative count of Article Views (full-text article views including HTML views, PDF and ePub downloads, according to the available data) and Abstracts Views on Vision4Press platform.
Data correspond to usage on the plateform after 2015. The current usage metrics is available 48-96 hours after online publication and is updated daily on week days.
Initial download of the metrics may take a while.