Fig. 16
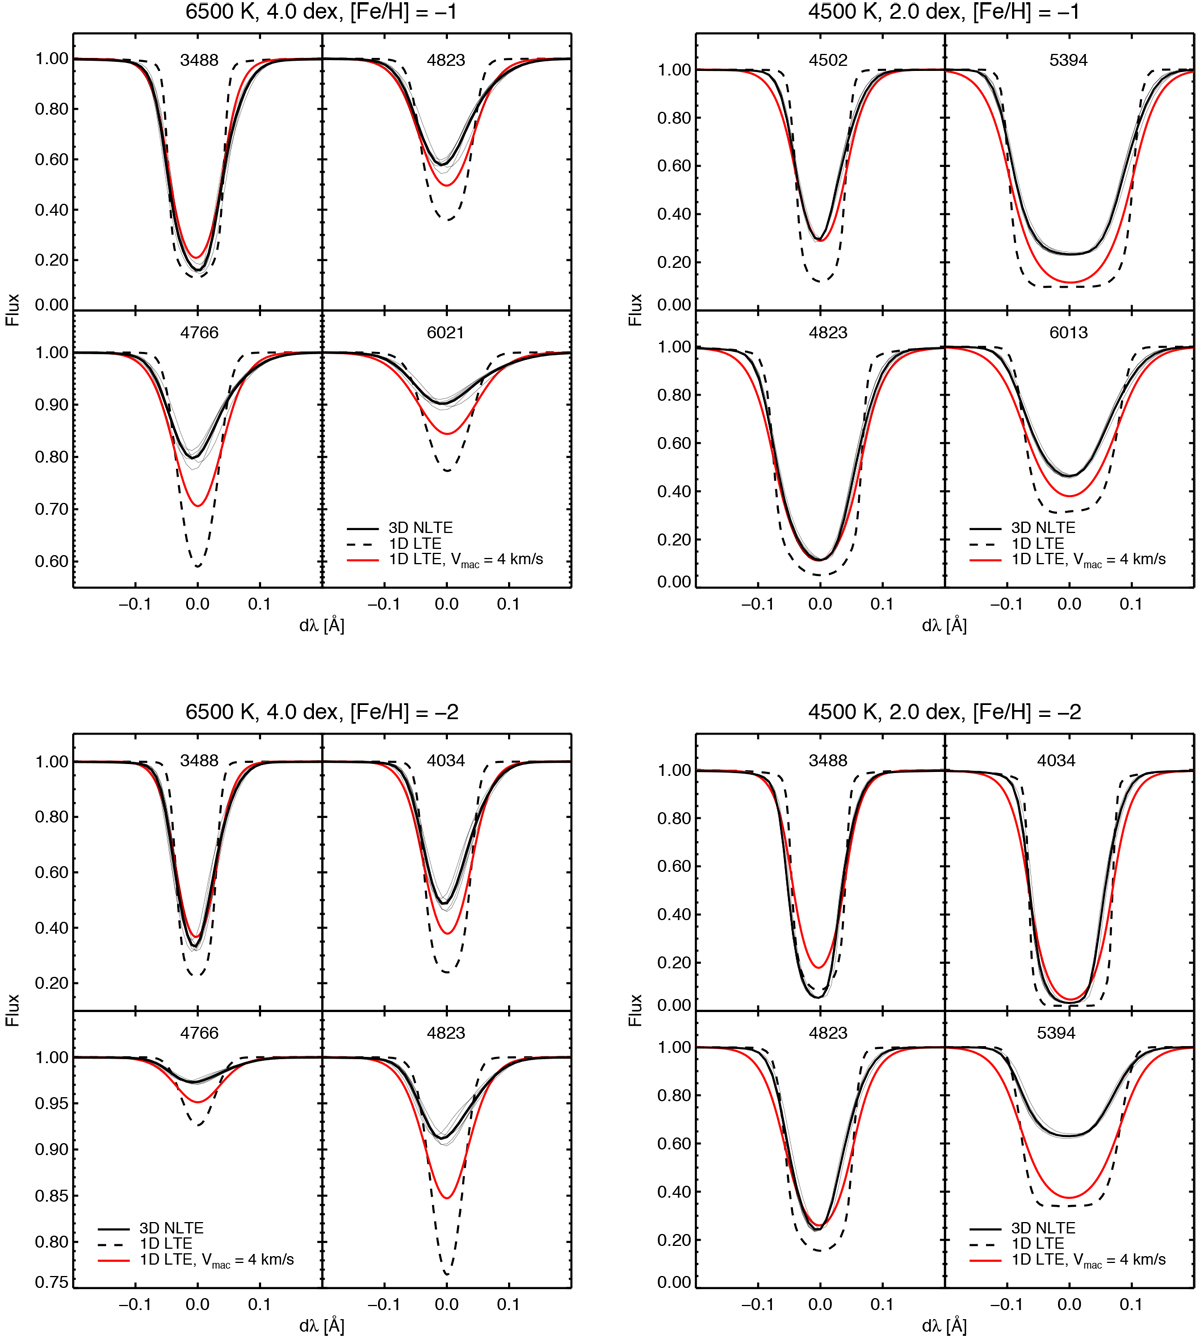
Line profiles of selected Mn I lines in dwarf and RGB models with metallicities [Fe ∕H ] = −1 (top panels) and [Fe∕H] = − 2 (bottom panels). Thick solid curves correspond to the averaged profiles from five snapshots taken at equidistant time steps. Thin lines are the profiles from individual snapshots. 1D LTE profiles are computed assuming ξt = 1 km s−1. The 1D LTEprofiles would be stronger, if larger ξt values were assumed. Note that different spectral lines of Mn I and Mn II are shown in the panels.
Current usage metrics show cumulative count of Article Views (full-text article views including HTML views, PDF and ePub downloads, according to the available data) and Abstracts Views on Vision4Press platform.
Data correspond to usage on the plateform after 2015. The current usage metrics is available 48-96 hours after online publication and is updated daily on week days.
Initial download of the metrics may take a while.