| Issue |
A&A
Volume 631, November 2019
|
|
|---|---|---|
| Article Number | A151 | |
| Number of page(s) | 12 | |
| Section | Planets and planetary systems | |
| DOI | https://doi.org/10.1051/0004-6361/201935777 | |
| Published online | 13 November 2019 | |
Adsorption isotherms and nucleation of methane and ethane on an analog of Titan’s photochemical aerosols
1
GSMA, UMR CNRS 7331, Université de Reims Champagne-Ardenne,
Reims,
France
e-mail: This email address is being protected from spambots. You need JavaScript enabled to view it.
2
Department of Chemistry and Biochemistry, California State University,
Fullerton,
CA,
USA
3
Cooperative Institute for Research in Environmental Sciences, University of Colorado,
Boulder,
CO,
USA
Received:
25
April
2019
Accepted:
12
September
2019
Abstract
In planetary atmospheres, adsorption of volatile molecules occurs on aerosols prior to nucleation and condensation. Therefore, the way adsorption occurs affects the subsequent steps of cloud formation. In the classical theory of heterogeneous nucleation, several physical quantities are needed for gas condensing on a substrate like aerosols, such as the desorption energies of the condensing gases on the substrate and the wetting parameters of the condensed phases on the substrate. For most planetary atmospheres, the values of such quantities are poorly known. In cloud models, these values are often approximately defined from more or less similar cases or simply fixed to reproduce macroscopic observable quantities such as cloud opacities. In this work, we used the results of a laboratory experiment in which methane and ethane adsorption isotherms on tholin, an analog of photochemical aerosols, are determined. This experiment also permits determination of the critical saturation ratio of nucleation. With this information we then retrieved the desorption energies of methane and ethane, which are the quantitative functions describing the adsorption isotherms and wetting parameters of these two condensates on tholin. We find that adsorption of methane on tholin is well explained by a Langmuir isotherm and a desorption energy ΔFo = 1.519 ± 0.0715 × 10⁻²⁰ J. Adsorption of ethane tholin can be represented by a Brunauer-Emmett-Teller isotherm of type III. The desorption energy of ethane on tholin that we retrieved is ΔFo = 2.35 ± 0.03 × 10⁻²⁰ J. We also determine that the wetting coefficients of methane and ethane on tholin are m = 0.994 ± 0.001 and m = 0.966 ± 0.007, respectively. Although these results are obtained from experiments representative of the Titan case, they are also of general value in cases of photochemical aerosols in other planetary atmospheres.
Key words: planets and satellites: atmospheres / methods: laboratory: solid state
© P. Rannou et al. 2019
 Open Access article, published by EDP Sciences, under the terms of the Creative Commons Attribution License (http://creativecommons.org/licenses/by/4.0), which permits unrestricted use, distribution, and reproduction in any medium, provided the original work is properly cited.
1 Introduction
Cloud models for planetary atmosphere are essentially based on the classical theory of nucleation and condensation as proposed, for instance, in Pruppacher & Klett (1997). These models are generally successful in explaining observations of cloud features in atmospheres of the solar system’s planets and they can also give key information about the various cycles taking place in these worlds (e.g., Moses et al. 1992; Michelangeli et al. 1993; Montmessin et al. 2002; Barth & Toon 2003; Rannou et al. 2006; Navarro et al. 2014). However, such models need some physical properties as input parameters.
For cloud formation, when the saturation ratio exceeds S = 1, nucleation corresponds to the agglomeration under Maxwellian statistics of enough molecules to form embryos of radius r beyond a critical radius rcrit. With r > rcrit, such embryos can grow spontaneously by condensation and form droplets. However, a saturation ratio larger than 1 is a thermodynamical condition that only makes condensation possible. To observe a perceptible condensation, it is also necessary to have a large enough nucleation rate J (that is, the number of nuclei with r = rcrit, then ready to grow, formed per unit of time and volume). For given conditions, there is a critical saturation S = Scrit larger than 1 for which the nucleation rates become large enough (J > Jcrit) to trigger a perceptible condensation. This onset of condensation is sudden, very sensitive to S and is quasi-simultaneous with the condition J > Jcrit. Thus, the condensation onset allows the definition of the threshold S = Scrit saturation ratio. Alternatively, it is sometimes useful to define an empirical threshold value directly (or at least an order of magnitude) on the nucleation rate Jcrit to define S = Scrit.
Nucleation and condensation models need many thermodynamical properties, such as vapor pressures Pv(T), latent heats Lv(T), and surface tension σ(T), at low temperatures. Thermodynamical properties are generally modeled by analytical laws directly taken from theoretical considerations, empirical laws established to fit measurements, or a combination of both (Reid et al. 1988; Fray & Schmitt 2009). The accuracy of these laws can be evaluated against available measurements and extrapolated to temperatures where no data exist. For nucleation, we also need the wetting coefficient m, which is the cosine of the contact angle between the air-condensate interface of an embryo of molecules (prior to condensation) and the surface of the substrate below the embryo. This is needed to relate the volume of condensate and the curvature radius of the embryo. Finally, we also need the desorption energy of adsorbed molecules at the surface of condensation nuclei (ΔF). These quantities cannot be fully derived from general thermodynamics laws and generally must be experimentally constrained.
The value of m can be retrieved, in theory, from the surface energy at the interface of the three media involved in the droplet geometry; the condensate–air (σc∕a), condensate–nuclei (σc∕n), and air–nuclei (σa∕n). However, these three surface energies are rarely available and generally only the surface tension σc∕a can be evaluated. The condensate is generally idealized as a spherical cap, even if it is formed by ice. The surface of the substrate is assumed to be totally smooth, which is surely not always the case at submicrometric scales. It is then common and convenient to use the surface tension (σc∕a) combined with the wetting coefficient (m) used as a free parameter rather than the three surface energies. In the vast majority of the cases, regardless of the planet, the condensing gases and the nature of the solid nuclei, the wetting parameters (m) are chosen in the range between 0.9 and 1. Such high values are needed to produce clouds and remove enough gas from atmosphere to produce the observed vertical profiles. In this circumstance, m should be regarded as an effective parameter that accounts for all the complexity of the interaction between the condensate and the nuclei.
The desorption energy is also a quantity of interest when heterogeneous nucleation occurs. In the case of homogeneous nucleation, embryos form spontaneously in the gaseous phase according to the laws of statistical physics. When condensation nuclei such as aerosols are available, nucleation is greatly facilitated. The surface of the nuclei offers adsorption sites that are able to capture molecules that can produce embryos more easily at the surface of the nuclei than in the free atmosphere. The build up of critical embryos, which are able to nucleate and start condensation, results from the balance between the incoming molecules onto the existing embryo and the desorption rate of molecules already adsorbed. To compute nucleation rates, we then need to know the desorption energy of a molecule of the nucleating species on the solid substrate. The nucleation rate is a very steep function of the saturation rate (e.g., Pruppacher & Klett 1997; Moses et al. 1992; Rannou & West 2018) and the critical saturation rate beyond which condensation starts depends on the desorption energy, especially on cold planets.
Published values of desorption energies for methane and ethane on photochemical aerosols, such as those found on Titan or in other planetary atmospheres such as the giant planets, do not exist in the literature. Thus values related to other cases, such as water (Seki & Hasegawa 1983) on mineral substrate or methane (Himeno et al. 2005) on various substrates, are often used instead. While using the value of Seki & Hasegawa (1983) is likely relevant for nucleation of water on martian dust (Montmessin et al. 2002) it is less justified for hydrocarbon nucleation on photochemical aerosols (e.g., Moses et al. 1992; Guez et al. 1997; Rannou et al. 2006). However this work-around is typically accepted because the desorption energies are always on the order of magnitude 10−20 J mol−1. For light hydrocarbons, the maximum desorption energies are found to be no larger than 3.5 × 10⁻²⁰ J mol−1 for methane and 6.3 × 10⁻²⁰ J mol−1 for acethylene (Atkins & De Paula 2006, Table 25.1).
To improve calculations of cloud formation, any source of information that allows better characterization of adsorption and nucleation on photochemical aerosols is worthy of interest. For this work, we used experimental data of methane and ethane adsorption on a laboratory analog of Titan aerosols, hereafter called tholin (Curtis et al. 2008). This study yielded, for each gases, the adsorption isotherms and critical saturation ratios beyond which condensation starts. Our scope is to determine, from experimental results, the ethane and methane desorption energies and their wetting parameters on tholin that could be used in microphysical models and climate models of Titan, or eventually giants planets.
The outline of the paper is described hereafter. In Sect. 2, we give the main information concerning the experiment performed by Curtis et al. (2008) and we describe the data that we used in this work. Then, in Sect. 3, we discuss the desorption isotherms of methane and ethane on tholin grains from the experimental results published by Curtis et al. (2008). We also describe the theoretical model behind the Langmuir and the Brunauer-Emmett-Teller (BET) isotherm, and use these models to fit the data. This allows for constraint of the desorption energies of methane and ethane on tholin. In Sect. 4, we discuss the classical theory of nucleation and we show how we modify the equation of nucleation rate to include consistently the desorption isotherms relevant to each case. We also discuss the theory of condensation, and we verify its validity in the case of a confined environment such as the Curtis et al. (2008) experiment. We then model the experiment with these laws of microphysics. We retrieve the wetting coefficients of methane and ethane on tholin by comparing the critical saturation beyond which condensation is triggered in our model and in the experimental results. The last section is dedicated to a discussion of our results and to the conclusion.
2 Description of the available data
Curtis et al. (2008) used an experimental system to study adsorption and condensation thresholds of methane and ethane onto various substrates. The experiment is a chamber in which the temperature and the pressure can be controlled. A substrate is set on a plate inside the chamber. The principle is to increase the vapor pressure of pure methane or pure ethane inside the chamber at a controlled temperature (45 K for methane and 75 K for ethane). As the vapor pressure increases, the gas molecules are more and more adsorbed on the substrate. Beyond a given pressure, or saturation ratio, the condensation suddenly occurs. To monitored the amount of methane or ethane on the substrate, Curtis et al. (2008) used an optical diagnostic. They monitored the absorbance of methane and ethane in adsorbed or condensed phase at wavenumbers 1300 ± 30 cm−1 and 818 ± 6 cm−1, respectively. With this, these authors were able to evaluate the total number of adsorbed molecules as the pressure increased during the experiment, and they were able to measure critical saturation ratio for condensation. Knowing the total surface of the substrate, they were able to display the adsorption isotherms as a function of saturation.
Curtis et al. (2008) performed experiments for methane and ethane adsorption on tholin grains, water ice, and the bare silicon wafer used to support the samples. They also performed an experiment with methane adsorption on ethane ice. We are especially interested in the experiment with ethane and methane on tholin since clouds appear on several planets with nucleation on this type of nuclei (Moses et al. 1992; Barth & Toon 2003; Rannou et al. 2006). These two cases are also the only examples for which all the information is available in Curtis et al. (2008) for an in-depth study. The data that we are using in this work are the size distribution of the tholin grains, the adsorption isotherms (Fig. 1), and other quantitative information given in their article and reported in the text when needed. For the other cases reported in Curtis et al. (2008), the adsorption isotherms are generally not perceptible before condensation owing to the much smaller specific areas of the various ices and the wafer, which are basically flat surfaces, compared to the complex and fluffy aggregated tholin grains.
Specific experiments dedicated to condensation, different from the adsorption experiments, were repeatedly performed on the same sample of tholin material. After each experiment, the sample was heated back up to room temperature while pumping on it to remove the methane or ethane. Then the experiment was repeated. Five experiments with methane and four with ethane were performed. No more than one experiment was performed per day. The value of saturation ratio at condensation seemed to vary randomly, so it was concluded that using the same sample several times did not differ from using fresh tholin. Curtis et al. (2008) evaluated the critical saturation ratio for methane on tholin and ethane on tholin to be Scrit = 1.07 ± 0.008 and Scrit = 1.36 ± 0.08, respectively (Curtis et al. 2008).
We reproduced the size distribution of the tholin grains described in Curtis et al. (2008) (Fig. 1, top). The amount of tholin is determined by the total mass of material, 1.5 × 10⁻⁷ kg, and we used their value for the tholin mass density (ρth = 800 kg m−3) to fix the absolute size distribution. We also found a surface-to-volume ratio (S∕V) = 1.72 × 10⁷ m−1 that is consistent with their value S∕V = 2.2 ± 1.3 × 10⁷ m−1. Finally, we used their value of surface density of adsorption sites on tholin δsite = 4.1 × 10¹⁸ m−2. It is necessary to determine the absolute surface of tholin grains and of the adsorbed gas because the beginning of the condensation is detected with thresholds on the transmitted light through the condensed phase. The total amounts of adsorbed methane or ethane and of tholin are assumed to be homogeneously distributed on the silicon wafer (1.57 × 10⁻⁴ m2) on which they are deposited.
Curtis et al. (2008) performed the experiments at 45 K for methane leading, at S = 1, to a partial pressure Px = 2.17 × 10⁻² Pa and at 75 K for ethane leading to Px = 3.77 × 10⁻³ Pa (Fray & Schmitt 2009). Under these conditions, the molecule mean free paths are ≃8.1 × 10⁻³ and ≃5.5 × 10⁻² m respectively.
This data set was previously studied by Barth & Toon (2006), with the method described in Curtis et al. (2005), and by Lavvas et al. (2011). In these two works, the purpose was to retrieve the wetting coefficients. Both works adopted the same approach using the heterogeneous nucleation rate with surface diffusion, JHSD, from classical nucleation theory. The nucleation rate increases with the saturation ratio S and also strongly depends on the wetting coefficient m. These studies first defined a critical threshold of the nucleation rate, Jcrit = 104 m−2 s−1 (Curtis et al. 2005) or Jcrit = 1 particle−1s−1 (Lavvas et al. 2011), beyond which condensation is assumed to occur. It is possible to find the saturation ratio S = Scrit, which gives JHSD = Jcrit. However, the value of Scrit strongly depends on m. Using the experimental conditions and comparing with the observed values of  , they can adjust the value of m to obtain JHSD = Jcrit at the value
  , as in the experiment. Proceeding in this way with the experimental data of methane and ethane condensation on tholins, each author proposed two values of m, which are reported later for comparison with our own results. However, these two works omit that the nucleation rate also depends on the desorption energies, which can also be retrieved from experiments. Instead they used a prefactor extracted from a terrestrial case in the theoretical expression of J (Barth & Toon 2006 and Curtis et al. 2005) or the desorption energy of Seki & Hasegawa (1983) (Lavvas et al. 2011).
In our work, we first retrieved the desorption energies from the experimental adsorption isotherms published by Curtis et al. (2008). We carried this out by comparing the data with models of adsorption isotherms, described in detail further. In a second step, we used these desorption energies to compute the nucleation rates. We used a 0D microphysical model to perform a time resolved simulation of condensation experiment by Curtis et al. (2008). We computed the nucleation rate of methane or ethane on tholin and the condensation growth, using the experimental conditions. As the saturation increases, the model predicts a sudden onset of condensation at a critical saturation ratio Scrit. As in the previous works, the sensitivity of this critical saturation ratio to the wetting coefficient m allows, by comparing with the experimental values, the determination of the value of m for methaneand ethane on tholin. To determine the value of the critical saturation ratio Scrit, instead of using a critical threshold for the nucleation rate J as in the previous works, we considered the condensation threshold. As for the experiment, we determined the transmission through the condensed phase at specific wavenumbers used for the optical diagnostics in the experiment (Curtis et al. 2008). This allows us to probe the rapid increase in opacity associated with the rapid onset of condensation. This finally yields a value of m for each gas that is discussed.
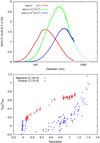 |
Fig. 1 Top: size distribution of the tholin grains in the experiment of Curtis et al. (2008). The solid lines correspond to the actual published data and the dashed lines correspond to an extrapolation made in this work to complete the distribution.Bottom: measured adsorption isotherms (ratio of adsorbed molecules relative to the number of adsorption sites) of methane and ethane on tholin as a function of the saturation ratio (Curtis et al. 2008). |
3 Description of physical adsorption
According to the International Union for Pure and Applied Chemistry (IUPAC), adsorption isotherms are classified in six different types (Thommes et al. 2015 and Lowell et al. 2004). The type of adsorption isotherms depends on the adsorbing molecules, the geometrical properties of the substrate, and primarily on the size of the pores that allow adsorption. Isotherms published by Curtis et al. (2008) (Fig. 1) for methane and ethane on tholin substrate can be associated with the type I and type III isotherms. The type I isotherm is well represented by the Langmuir isotherm corresponding to adsorption of a monolayer of molecules on the substrate. In this case, the interstices between atoms of the tholin molecular structure are assumed to be micropores of few nanometers able to receive and trap molecules by Van Der Waals interactions. The type III isotherm is a case of adsorption that can be represented by the BET isotherm. The underlying theory assumes that adsorption does not occur with a monolayer of molecules covering the substrate. Rather, it accounts for the possibility that molecules could adsorb onto a layer of molecules already adsorbed. In this case, the molecules can form patches of stacked layers rather than covering the substrate with a monolayer. The type III isotherm appears when the desorption energy on the substrate is sufficiently small compared to the desorption energy on existing adsorbed layer to favor the latter.
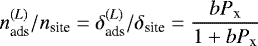
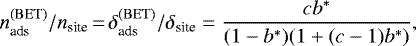
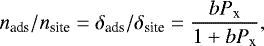
The theoretical developments of the Langmuir and BET isotherms have led to the number of adsorbed molecules relative to the number of adsorption sites, nads∕nsite as a function of the thermodynamical parameters (temperature, pressure,...). In this article, we note nads the total number of adsorbed molecules and nsite the total number of adsorption sites. The equations δads = nads∕Σ and δsite = nsite∕Σ are the corresponding surface densities and Σ the total surface of substrate available.
3.1 Adsorption of methane with the Langmuir isotherm
The derivation of the Langmuir isotherm is described in the appendix. In this work we used the form
 (1)
(1)
where
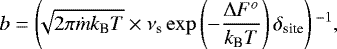 (2)
(2)
and δads and δsite are the surface density of adsorbed molecules and of adsorption sites, respectively. The value Px is partial pressure of the gas that is adsorbed, ṁ the mass of one molecule, kB the Botzmann constant, T the temperature, and νs is the jump frequency, which represents the frequency of attempts for a molecule to escape from an adsorption site. The quantity ΔFo is the desorption energy needed for a molecule to desorb from the substrate.
The jump frequency, νs, is directly linked to the fundamental vibration frequency of the molecules, which is a well-known property. The main vibration mode of methane and ethane is around nvib = 3000 ± 50 cm−1, giving νvib ≃ 9 × 10¹³ s−1. Since νs only counts the jump attempts in the vertical direction, it may be evaluated to about 10 to 30% of the total vibration rate νvib. To get this evaluation, we assumed randomly distributed orientations of vibration and counted cases with vibration axis at less than 30° or 45° from the normal direction to the plane. These basic considerations show that νs ≃ 1013 s−1.
To study the methane adsorption with the Langmuir isotherm, we defined a cost function 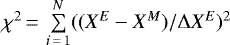 , where XE and XM are the experimental and modeled values of
  and ΔXE the experimental error on XE, evaluated to ΔXE ≃ 0.042. The data points are more concentrated around the low values of saturation (S < 0.25) and at high values (S > 0.75). There are only 22 data points out of 144 in the central interval 0.25 < S < 0.75 and only 9 in the range 0.50 < S < 0.75. To evaluate the effect of this bias, we either used the data as they are (case “No weight”) or we attributed a different weight to data points depending on their values of S. We used two different sets of weights. For the first case, we gave half of the total weight to the 22 values between 0.25 < S < 0.75 and the other half to the 122 remaining values (case “Weight #1”). The intent is to give a weight about proportional to the size of the interval along S. For the second case, we gave a quarter of the weight to the 9 values between 0.50 < S < 0.75 and three quarters to the 135 remaining values (case “Weight #2”). In practice, this does not deeply affect the retrieval with the Langmuir isotherm.
Once the value of b is determined, the only parameter to retrieve is the desorption energy, ΔFo (Eq. (2)). From the experimental isotherm, and using a parametrized version of the Langmuir isotherm (Eq. (1)), we found the value  Pa−1 and then ΔFo = 1.519 ± 0.006 × 10⁻²⁰ J (Fig. 2). This is consistent with the previous evaluation, b = 105.54 ± 5.11 Pa−1, obtained by Curtis et al. (2008). Any uncertainties on the other parameters, such as the jump frequency or the density of adsorption sites, leads to uncertainties on the value ΔFo. If we assumed an uncertainty of one order of magnitude for the other parameters, we found ΔFo = 1.519 ± 0.0715 × 10⁻²⁰ J. If we modified the weight of the data as mentioned above, the desorption energies become ΔFo = 1.50510−20 J and ΔFo = 1.51810−20 J for the cases “Weight #1” and “Weight #2”, respectively. The relative difference is about 1% and the absolutedifference is much smaller than the uncertainties due to other parameters. The desorption energy of methane on tholin evaluated in this work is a factor of 2 lower than the values generally used in previous works (e.g., ΔFo = 2.88 × 10⁻²⁰ J for Seki & Hasegawa 1983 and ΔFo = 3.03 × 10⁻²⁰ J for Himeno et al. 2005).
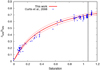 |
Fig. 2 Adsorption isotherm of methane on tholin substrate. The blue dots show the number of adsorbed molecules scaled to the number of adsorption sites and the thick red line shows the isotherm obtained with ΔFo = 1.519 × 10⁻²⁰ J to match the Curtis et al. (2008) isotherm for methane (their Fig. 7). The other isotherms (thin red lines) are obtained with ΔFo = (1.519 ± 0.006) × 10−20 J. The vertical solid and dashed lines show the condensation threshold at S = 1.07 ± 0.008. |
3.2 Description of the Brunauer-Emmett-Teller isotherm
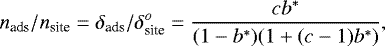
The theory behind the BET adsorption model is also described in the appendix. It can be used to explain the type III isotherm observed foradsorption of ethane on tholin. It is also able to match the type I isotherm, generally explained by the Langmuir isotherm. This theory is frequently used when isotherms more complicated than Langmuir isotherm are needed (e.g., Farris et al. 2018) and it is also criticized for its conceptual simplicity (e.g., Laaksonen 2015). However, in the case of this study, it has the great advantage to allow a straightforward link between the shape of the isotherm and the underlying physical parameters. The amount of adsorbed molecules is expressed as
 (3)
(3)
with
 (4)
(4)
and
 (5)
(5)
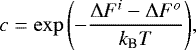
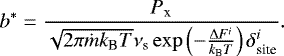
The quantity ΔFo is the desorption energy from the substrate. The value ΔFi is the desorption energy from the adsorbed phase, and is assumed to be close to the vaporization or sublimation latent heat of the corresponding condensed phase. However, the adsorbed phase is not identical to a condensed phase and therefore ΔFi is treated as a free parameter. The other terms are similar to those described for the Langmuir model. The parameter c is linked to the difference ΔFo − ΔFi. The parameter b* has the same form as b × Px for the Langmuir isotherm, but depends on ΔFi instead of ΔFo.
This setup of the BET isotherm assumes that the density of adsorption sites on tholin  and on the condensed ethane
  are the same. The number density of adsorption sites,
  , is roughly defined by the size of the adsorption sites that the substrate offers. We can use the Van der Waals radius of ethane (2.95 × 10⁻¹⁰ m) and methane (1.88 × 10⁻¹⁰ m) or the mass density of their ice (544 and 425 kg m−3, respectively) to evaluate the surface density of ethane in the solid phase. We assumed that the adsorption sites are the interstices between the molecules of the solid phase. Both approaches give
  m−2, which compares well with the value
  m−2 suggested by Curtis et al. (2008) for the tholin substrate. This validates the assumption
  . Similarly, the jump frequencies of ethane and methane molecules on the tholin substrate,
  , and on the condensed ethane or methane,
  , are also assumed to be equal. This makes sense because the jump frequency is primarily a property of the adsorbed molecules and not of the substrate.
3.3 Adsorption of ethane on tholin with the BET
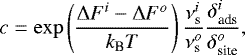
As for the case of the methane adsorption, the ethane adsorption isotherm should allow retrieval of physical properties related to the adsorption of ethane molecules on tholin. We can seek the best match between the theoretical and experimental adsorption curves by varying c and α. For convenience, we defined
 (6)
(6)
which contains the energy dependence of the term b*. The retrieved values of c and α allowed us to fix the desorption energies ΔFi and ΔFo and the isotherm adsorption through the Eqs. (3)–(5). This relies on the fact that all the physical quantities aside from the energy terms are assumed to be well known. We defined a cost function of the type  , where XE and XM are the experimental and modeled values of
  and ΔXE the experimental error on XE, evaluated to ΔXE ≃ 0.1. In this case, the data set is better sampled with S and we did not modify the weight of the data in the value of χ2.
The best values are found for c = 0.067 and α = 9.05 × 10⁻¹² (Figs. 3 and 4). The values of c and α at the far edges of the uncertainty ellipse are cm = 0.052, αm = 8.79 × 10⁻¹², and cM = 0.087, αM = 9.39 × 10⁻¹². The value of α directly provides the desorption energy of ethane on ethane adsorbed layers  J. The term c allowed us to get ΔFo relative to ΔFi through the relation ΔFo = ΔFi + kBTlog (c) (Eq. (4)). We then found the desorption energy of ethane on tholin ΔFo = 2.35 ± 0.03 × 10⁻²⁰ J. This energy term is smaller but comparable to the desorption energy used previously (ΔFo = 2.88 × 10⁻²⁰ J or ΔFo = 3.03 × 10⁻²⁰ J).
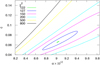 |
Fig. 3 Map of χ2 values as a function of α and c obtained by matching the parametrized BET isotherm (Eqs. (3)–(6)) and the experimental isotherm for ethane adsorption on tholin (Curtis et al. 2008). The best value is obtained for α = 9.05 × 10⁻¹² and c = 0.067. The second contour (blue) indicates the 2σ level. This contour is used to provide an idea of the uncertainties on the values of α and c, and further on the energy terms. |
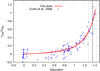 |
Fig. 4 Adsorption isotherm of ethane on tholin substrate. The blue dots show the isotherm obtained from experiment (Fig. 11 of Curtis et al. 2008) The thick red line shows the best match of the isotherm obtained with the BET theory (Fig. 3) and the thin red lines show the isotherms obtained with the extreme values of the 2σ confidence ellipse. The vertical solid and dashed lines show the condensation threshold at S = 1.36 ± 0.08. |
3.4 Retrieved desorption energies
Table 1 gives a summary of the desorption energies retrieved from our analysis. The Langmuir adsorption isotherm matches well the methane adsorption on tholins and retrieving the desorption energy is straightforward. Considering ethane, only the BET isotherm can explain the measurements and, although the data appears to be quite scattered, the sampling is homogeneous as a function of S and can be analyzed without invoking any specific weighting. This shape of the adsorption isotherm, related to type III in the IUPAC classification, characterizes a low capacity of tholin to uptake ethane. Similar adsorption isotherms exist on Earth for water on organic powders or mineral aerosols covered by chemical products (e.g., Gustafsson et al. 2005; Garland et al. 2005, and Zotarelli et al. 2017).
The temperatures at which experiments by Curtis et al. (2008) were performed are not exactly representative of Titan temperatures. Especially, the experimental temperature for the methane isotherm, 45 K is 30 to 40 K lower than Titan’s tropospheric temperature. However, desorption energies should not strongly depend on the temperature. The physical adsorption (or physisorption) is due to the sticking of molecules on a substrate from Van der Waals forces. Several components contribute to the Van der Waals potential: the Keesom force, London force and Debye force (e.g., Funk & Dinger 1994). These forces are all, by nature, linked to interactions between permanent dipoles, induced dipoles, and cross interactions between permanent and induced dipoles of the gaseous molecules and the substrate. However, only interactions between permanent dipoles (Keesom term) depend on temperature, and methane and ethane do not have such permanent dipoles. For this reason, we expect that desorption energies do not depend strongly on the temperature.
A second argument can be found in experimental or theoretical works dedicated to the effect of temperature on adsorption. Experiments conducted to study the effect of temperature on the adsorption of methane on coal samples in terrestrial conditions between 285 and 345 K (Chen et al. 2011) and Guan et al. (2018) show that adsorption parameters (Langmuir parameters or adsorption energy) are stable up to 330 K (Chen et al. 2011) or vary by less that 30% (Guan et al. 2018), but have a rapid change beyond. We should note that, at these high temperatures, methane is beyond the critical point. Of course, terrestrial temperatures are not representative either. Numerical simulations, which were performed using a Grand Canonical Monte Carlo model (Dundar et al. 2016) between 80 and 140 K with a prescription of the Van de Waals potential given by the Universal Force Field published by Rappe et al. (1992), show that the desorption energy of methane on a given substrate or on the layer of adsorbed methane is stable with temperature. We can evaluate from their results that desorption energies of the adsorbed phase is constant within 15% in the temperature range 80–180 K and the desorption energy on the substrate is assumed to be constant (Rappe et al. 1992).
Retrieved desorption energies.
4 Modeling of the experiment
To model the experiment of Curtis et al. (2008), we used a 0D microphysical model based on models used previously (e.g., Rannou et al. 2006). We computed the nucleation rate and the condensation growth of methane or ethane for the experimental conditions (thermodynamical conditions and tholin grain distribution), using a time resolved model. When condensation occurs, the amount of liquid was probed with a measurement of transmission through the sample at specific wavenumbers. We mimic this measurement by computing the absorption of the modeled condensed methane or ethane at the same wavenumbers. This allowed us to detect the critical saturation ratio at which condensation starts. In this section we detail and discuss the different processes behind the modeling.
4.1 Adaptation of the nucleation rate equation
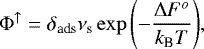
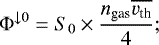
We used the theory of nucleation as described in Pruppacher & Klett (1997). The core of the nucleation theory has also been reviewed, in a simplified version, in Rannou & West (2018). To model the methane and ethane nucleation on tholin we used the sublimation enthalpies retrieved previously from the analysis of the adsorption isotherms. We note an internal inconsistency in using the classical law of nucleation as written by Pruppacher & Klett (1997) for methane and ethane. In these equations, the nucleation is assumed to be triggered by the formation of embryos made of molecules adsorbed on the substrate. The surface concentration of molecules is set according to a simple equilibrium between the incoming flux of molecules at the surface of the nuclei and the desorption flux (Eq. (9.7) of Pruppacher & Klett 1997) as follows:
 (7)
(7)
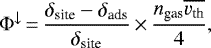
Notably, there is no reference to the total number of adsorption sites of the substrate in this definition of δads. The value ϕ↓ is given by  , where ngas is the density of molecules and
  their mean thermal speed. This definition of δads is equivalent to the linear part of the Langmuir isotherm and could be written δads = bPxδsite. The term δsite cancels out in the product b × δsite and then δads is boundless. This isotherm used in the classical theory of the nucleation is referred as the linear or PK isotherm in this paper.
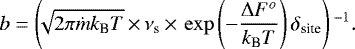
We know from the adsorption isotherms of methane and ethane on tholin that the equilibrium between the desorption flux of adsorbed molecules and the incoming flux of molecules from the surrounding gas differs from the rules assumed in classical nucleation theory. The Langmuir and BET isotherms are shown to give better results to explain methane and ethane adsorption isotherms. They should eventually used be for the calculation of the nucleation rate. A similar approach was already proposed by Laaksonen (2015). The modifications to bring to the nucleation rates are straightforward since the number of adsorbed molecules appears explicitly in the equation of nucleation (Eqs. (9.8) and (9.9) of Pruppacher & Klett 1997) as
![Mathematical equation: \begin{equation*} J^{^{\textrm{HSD}}} = Z \,{\times}\, 2 \pi r^{*^2} \delta_{\textrm{ads}}^2 \nu_{\textrm{s}} \exp(-[\Delta F'(r^*) + \Delta F_{\textrm{sd}}]/ kT) \end{equation*}](/articles/aa/full_html/2019/11/aa35777-19/aa35777-19-eq26.png) (8)
(8)
If we replace δads by the result of the Langmuir adsorption isotherm,  , the new nucleation rate,
  is simply modified as
 (9)
(9)
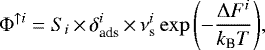
If, instead, we replace δads by the result of the BET adsorption isotherm,  , the nucleation rate can be expressed as
 (10)
(10)
where b* and c have the same meaning as previously. Computing  does not require more information than those used to compute
  . For
. For  , only the energy term ΔFi is needed as an additional parameter and this equation is only valid if b* < 1 because of the singularity at b* = 1. This limit is obviously reached after the condensation threshold.
4.2 Condensation process
In the experiment of Curtis et al. (2008), the pressure of the gas is very low due to the low vapor pressures of methane at 45 K and ethane at 75 K. The experiment was performed with pure vapors. We found that the mean free path of the gas,  , is between 1.6 × 10⁻¹m and 8 × 10⁻³m for the saturation ratio S between 0.05 to 1. Even with S = 1, the molecules mean free path is not much smaller than the size of the experimental chamber, that is, a cylinder of ≃0.2 m long and 0.15 m in diameter). The growth rate gr = rdr∕dt (Eqs. (13)–(28) from Pruppacher & Klett 1997) assumes condensation in a free atmosphere. To write this equation, it is assumed that the condensing gas is a trace species in a background atmosphere and that there is a diffusive steady state for the gas transport to the droplet and for the heat transport from the droplet to the free atmosphere. However, the expression is corrected to include the effect of the kinetic regime (that with a large Knudsen numbers,
  ).
).
In the experiment of Curtis et al. (2008), the size of the chamber is barely more than ten times the molecules mean free path, which is too small to consider that equations for a free atmosphere are usable without validation. At the same time, the mean free path is much larger than the tholin grains on which condensation occurs, and thus we are clearly in the kinetic regime. Moreover, in the experiment, we are dealing with pure gases. Since there is no interaction between molecules in the kinetic regime and there is no diffusion process, we expected that the correction for the kinetic regime to be adapted to the experimental condition.
To check the validity of the equation of Pruppacher & Klett (1997) in the context of Curtis et al. (2008) experiment, we used simple kinetic arguments. The growth rate can be expressed as the collected mass per unit of time, d μ∕dt, by a droplet due the incoming flux onto its surface dμ∕dt = 4πr2 × Φ↓ × ṁ, where r is the particle radius, Φ↓ is the molecule flux onto the particle and ṁ the mass of a single molecule of condensate. The growth rate can then be written, for a pure gas, as
 (11)
(11)
where Px is the partial pressure of the condensing gas, ρi the mass density of its condensed phase, Mi the molar mass, Rg the ideal gasconstant, T the temperature, and S and SEQ are the saturation ratio and the equilibrium saturation ratio. The kinetic approximation assumes an isotropical Maxwellian distribution of molecule speeds related to the temperature and that all molecules in excess to the saturation hitting the surface enter in the condensed phase. We have checked that the general equation of Pruppacher & Klett (1997), with the correction for the molecular regime, converges to the same form as the equation given above for large Knudsen numbers ( ) with a supplementary prefactor with numerical value γ ≃ 0.8673. Therefore, we can use impartially the equation Eqs. (13)–(28) from Pruppacher & Klett (1997) or the equation above given by simple kinetic arguments multiplied by γ.
We note that Listowski et al. (2013) studied the case of condensation of pure CO2 in the martian environment that is comparable to the environment in Curtis’ chamber. Their study was performed with a more general development including the thermal transfer, which is not needed in our case. However, their results show that for low supersaturation, the classical theory is sufficient to describe the condensation of a pure gas in kinetic regime. For a saturation ratio of 1.4 and a pressure of 0.02 Pa, similar to the case of ethane, the error is about 25%. This should be considered as an upper value since in absence of thermal effect, the isotherm kinetic theory prevails.
4.3 Principle for the retrieval of wetting coefficients
In order to retrieve the wetting coefficient of methane and ethane on tholin, we modeled the experiment made by Curtis et al. (2008). We started with a gas pressure Px = 0 and we increased the pressure at the same average rate as in the experiment. In Curtis’ experiment, the saturation ratio S rose by steps. We evaluated, from the experimental description, that the time to reach the saturation S ≃ 1 is about ΔtS = 700 s. The evolution in the model is time resolved and the increase of pressure in the experiment is slow enough to allow the experiment to be close to the equilibrium state at each step. We verified this by checking the sensitivity of the result to ΔtS. At each time step, we computed the nucleation rate and the growth of condensates, when relevant, on the tholin material. We used the size distribution of tholin grains characterized by Curtis et al. (2008) and shown in Fig. 1.
The nucleation rate JHSD increases with increasing saturation S. When the nucleation exceeds a threshold, condensation starts and the amount of condensed material rapidly increases. This event occurs at a critical saturation ratio Scrit, which depends on the experimental conditions and the properties of tholin material supporting nucleation. The wetting coefficient m is the main unknown and it has a strong impact on the value of Scrit. The model predicts the number of droplets and their size, thus we could evaluate the corresponding opacity τ and absorbance A through the condensate material at the wavelengths used in the actual experiment (that is, 7.52 and 12.2 μm for methane and ethane, respectively). Because these wavelengths are much larger than the droplet size, we used the Rayleigh approximation. When condensation starts, the absorbance A is a sharp function of S (Fig. 5). We evaluated, from the absorbance spectra in Curtis et al. (2008) for methane and ethane, that onset of condensation can be detected when absorbance A exceeds ≃ 10−3; this is equivalent to an integrated absorbance of ≃ 10−2 cm−1 with a width of absorption peaks ≃ 10 cm−1. This criterion allowed us to determine the critical saturation ratio Scrit for condensation. Tests show that using other thresholds (e.g., between A = 3 × 10⁻⁴ and A = 3 × 10⁻³) does not change the results significantly. The changes due to this threshold are much smaller than changes due to other parameters of this study. We modeled the experiment for different values of the wetting coefficients m between − 1 and + 1, and found the critical saturation Scrit as functions of m. By comparing the modeled Scrit(m) to the observed saturation that triggerscondensation in Curtis et al. (2008) experiment, we were able to determine the wetting coefficient of the condensate species on tholin.
4.4 Results for the wetting coefficients
Our results are represented in Fig. 6 for different cases, and for methane and ethane. The setup of the different models are summarized in Table 2. In the case of methane, we first used the classical nucleation with the linear isotherm as described in Pruppacher & Klett (1997), with the new desorption energy defined in this work (ΔFo = 1.519 × 10⁻²⁰ J), and with the old value ΔFo = 2.880 × 10⁻²⁰ J (Rannou et al. 2006). We also used the model with the Langmuir isotherm to write the nucleation rate with the new desorption energy. This defines the “reference” case. We assume in our model a regular increase of S that leads to S = 1 within about ΔtS = 700 s. We tested, ΔtS = 350 and 1400 s. Then, we tested the sensitivity of the reference model to the desorption energies associated with the uncertainties on the coefficient b of the Langmuir isotherm (Fig. 2). We also studied the sensitivity to an uncertainty of a factor of 10 on the nucleation rate due to any physical properties not well constrained, such as the jump frequency, the density of adsorption site, or the Zeldovich number. These tests are described in Table 2 and the results shown in Fig. 6. We found that only the value of the desorption energy can significantly change the result. The other parameters, and even the use of the linear isotherm instead of the Langmuir isotherm in the equation of the nucleation rate, only produce minor changes and could probably be neglected. The values of the wetting coefficient of methane on tholin that are consistent with the experimental results are m = 0.994 ± 0.001 (Fig. 6, left).
In the case of ethane, the reference case is defined by the use of the BET isotherm along with the energy terms ΔFo = 2.35 × 10⁻²⁰ J and ΔFi = 2.63 × 10⁻²⁰ J. This corresponds to values of c = 0.067 and α = 9.05 × 10⁻¹², that is, the values at the minimum of the χ2 map of Fig. 3. As previously, the time to reach S = 1 is set to ΔtS = 700 s. We tested the sensitivity of the results to the type of isotherm and then we used the linear isotherm with the new desorption energy (ΔFo = 2.35 × 10⁻²⁰ J) and with the value ΔFo = 2.880 × 10⁻²⁰ J (Seki & Hasegawa 1983). We also tested the sensitivity to the value of ΔtS and to the parameters of the BET isotherm c and α (Eqs. (4) and (6)). We used the sets of values αm = 8.79 × 10⁻¹² and also used cm = 0.052, αM = 9.39 × 10⁻¹², and cM = 0.087, defined after the map in Fig. 3. The results (Fig. 6; right) show that using the BET isotherm to compute the nucleation rate produces significant differences compared with the classical law, even if the desorption energy of ethane on tholin is the same. The desorption energy of ethane on ethane ice ΔFi is also an important parameter for this type of isotherm. In this case, both the isotherm and the energy terms play an important role in the results. Considering the reference case, we find that the wetting coefficients of ethane on tholin which correspond to a critical saturation within the observed values are m = 0.966 ± 0.007.
The values of m found in this work can be compared to those retrieved from the same data set in other works (Table 3). We note that the retrieved values are quite similar to each other although prior evaluation of the desorption energies were not performed by Barth & Toon (2006) and Lavvas et al. (2011) and although the arguments are not exactly the same, for instance, about the triggering of condensation. In our work, we managed to stay as close as possible to the experiment and simulated the experiment in a time resolved approached to define the onset of condensation upon an optical threshold accurately.
 |
Fig. 5 Variations of absorbance as functions of saturation for the modeled experiment with methane and ethane, for different values of the wetting coefficient and for the reference cases (see “REF” cases in Table 2). For each curve, the absorbance threshold 10−3 is reached at given saturation ratios. These modeled values are compared to the value Scrit found in the experiment by Curtis et al. (2008) and shown as red and blue boxes for methane and ethane, respectively. This allows us, for each gas, to constrain the wetting parameter m for which the value of absorbance reaches 10−3 when S = Scrit. The lower and upper limits of the boxes are set at half a decade below and above the reference threshold 10−3. |
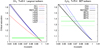 |
Fig. 6 Critical saturation ratio (at which condensation takes place) as a function of the wetting parameter in the numerical simulations reproducing Curtis et al. (2008) experiment. For both plots, the horizontal thick green line represents the observed critical saturation ratio and the green thin lines the upper and lower boundaries of the observed critical saturation due to standard deviation (Curtis et al. 2008). Left: results for methane are shown with the cases of linear isotherm used in Pruppacher & Klett (1997) (“PK”) and with the Langmuir isotherm (“LAN”). Right: results for ethane are shown with the linear isotherm (“PK”) and the BET isotherm (“BET”). For both plots, the label codes and model parameters are described in Table 2. |
Contact angles.
5 Discussion and conclusions
In this work, we used the experimental results of Curtis et al. (2008) concerning the adsorption and the onset of condensation of methane and ethane on tholin. Their experimental setup and their results are described in detail in their article. Thus it is a valuable set of information to characterize the adsorption and the nucleation of methane and ethane on tholin. We identified that methane adsorption on tholin follows a Langmuir isotherm (type I of the IUPAC classification) while ethane adsorption follows a BET isotherm (type III). Using the theoretical laws for the Langmuir and BET adsorption, we were able to determine the desorption energies of methane on tholin (ΔFo = 1.519 × 10⁻²⁰ J), ethane on tholin (ΔFo = 2.352 × 10⁻²⁰ J), and ethane on the ethane condensed phase (ΔFi = 2.632 × 10⁻²⁰ J) (Table 1). Once the adsorption isotherms are completely characterized, we could model the nucleation and condensation for the experiment reported in Curtis et al. (2008). These authors gradually increased the methane or ethane saturation ratio and they were able to detect the saturation ratio beyond which condensation starts. Modeling this experiment, we could determine the wetting coefficients of methane on tholin (m = 0.994 ± 0.001) and of ethane on tholin (m = 0.966 ± 0.007). We should note that these values are obtained with pure gases, but in a real atmosphere, we expect competitive adsorption processes between different species.
It should be absolutely kept in mind that these wetting factors describe effective characteristics of a liquid or ice condensate onto an idealized smooth substrate. The typical size of a molecular embryo prior to condensation is a fraction of nanometer and the interfacial conditions depend on the substrate structure at this subnanometric scale. Both the small scale morphology of the tholin and its chemical composition, affecting its physical properties, can be discussed. In our work, we used the results of an experiment that was performed with one type of tholin, similar to those produced by Khare et al. (1984). It was made under specific gaseous composition and production conditions. Unfortunately, existing images of these tholin do not have high enough resolution to check the surface morphology at the scale of few nanometers (Curtis et al. 2005). It is now well recognized that the details of the formation conditions change the composition of the tholin (e.g., Imanaka et al. 2004; Quirico et al. 2008; Gautier et al. 2012; Mahjoub et al. 2012; Brassé et al. 2015; Sciamma-O’Brien et al. 2017). Differences in composition imply probable differences in physical properties such as the desorption energy, wetting coefficient, and possibly the adsorption isotherm. To estimate the representativity of the adsorption properties and wetting coefficients found in this work, where tholin is similar to the experiment of Khare et al. (1984), other kinds of tholin should be used in similar experiments.
We also know that Titan’s aerosols are produced in the ionosphere. By the time these aerosols reach the low stratosphere, they are subjected to aging. Dimitrov & Bar-Nun (2002) showed, with theoretical considerations, that irradiation by short wavelength photons should change their chemical structure due to the breaking and cross-linking of chemical bounds in polymer chains. This was recently characterized with laboratory experiments. Carrasco et al. (2018) were able to monitor how tholin chemically evolves under irradiation by photons having wavelengths representative of the UV flux at altitudes between 600 km and 1000 km (λ = 95 nm and λ = 121 nm). With a diagnostic based on light absorption, these authors inferred that single chemical bounds are broken and recombined in double or triple bounds. Hydrogen atoms are then eliminated from the solid phase and the composition of the tholin increases in heavy atoms and in double and triple bonds. The changes occur through a depth inside the tholin layer comparable to the size of the elementary spheres composing Titan aggregated aerosols (that is radius ≃50 nm). Therefore, aging probably occurs within the bulk of Titan’s aerosols rather than at their surfaces. Following Dimitrov & Bar-Nun (2002), these chemical changes should correspond to a hardening of the material and an increase of the surface tension by a factor 10–100.
In a series of papers, Gudipati et al. (2013), Couturier-Tamburelli et al. (2014, 2015, 2018), and Fleury et al. (2019) investigated the transformation under irradiation of C4 N2, HC5N, HC3N, HCN, and C2 H2 ices into photochemical material. They used wavelengths larger than 230 nm or 300 nm, relevant to process that may occur in the low atmosphere. Their experiments clearly showed the formation of complex photochemical products. Since condensation of these types of ices occurs in the stratosphere up to 300 km (West et al. 2016; De Kok et al. 2014), this demonstrates that Titan aerosols may also evolve by incorporating new molecules produced by the photodissociation of ice. This can occur along the full atmospheric column and during a long period of time. We should remember that Titan’s aerosols do not only fall from the upper layers to the surface but are also lifted up by the summer ascending circulation of the stratospheric cell up to about several hundred kilometers (e.g., Rannou et al. 2004; Lebonnois et al. 2012; Larson et al. 2015). During their life, Titan aerosols can experience several cycles of gaseous adsorption and desorption, condensation and evaporation, and photochemical aging before settling to the ground. These works demonstrate that all condensed chemical species may be involved in aging and adsorption and desorption cycles. This opens a way for a permanent and long-term chemical evolution of aerosols and aging that yields compositions and physical properties of aerosols radically different from fresh laboratory tholin.
Aside from the chemical transformations, it would be interesting to know if there are also morphological transformations. Fresh aerosols appear generally smooth at the submicrometer scale (Bar-Nun et al. 1988; Scattergood et al. 1992) or with a more complex cauliflower-like surface structure at the scale of 10–100 nanometers (e.g., Carrasco et al. 2009; Hadamcik et al. 2011; Sciamma-O’Brien et al. 2017). Of course, the detail of the surface structure probably depends on the formation conditions and the final composition. In addition to changes in chemistry, if aging was also able to produce profound morphological changes such as cracks, wrinkles, or other alterations, this would have a large impact on the physical parameters like the type of the adsorption isotherm. The description of the IUPAC adsorption types clearly states that porosity and paths inside the volume of the adsorbing substrate modify the way adsorption occurs (Thommes et al. 2015), its capacity to uptake adsorbed molecules, and finally its properties regarding the triggering of condensation. Consequently, adsorption isotherms can also be used as diagnostics of change in surface morphology.
We believe that the type of experiments performed by Curtis et al. (2008) with methane and ethane should be replicated with other types of tholin, produced in way relevant for Titan or other planets. This would allow us to appreciate the validity of the present work and how different properties of different tholin vary regarding absorption and nucleation. Finally, such experiments should also be performed with processed tholin to simulate aging. It would bring a new insight into this topic since it would be more relevant to represent actual Titan aerosols.
Acknowledgements
P.R. thanks the anonymous reviewer for helpful comments on the manuscript.
Appendix A Langmuir isotherm
The Langmuir isotherm is associated with the type I isotherm Thommes et al. (2015). It is derived by equating the adsorption and desorption fluxes of molecules to the substrate. The adsorption flux can be written as
 (A.1)
(A.1)
where δads and δsite are the surface density of adsorbed molecule and of adsorption sites, respectively. The value ngas is the density of molecules and  their mean thermal speed. The quantity
  is the flux of molecules onto the substrate, which differs from Φ↓ by the fraction of sites still available on the substrate for adsorption. Pruppacher & Klett (1997) rather wrote
 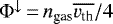 , neglecting the rate of occupancy of the adsorption sites. The desorption flux can be written as
 (A.2)
(A.2)
where νs is the jump frequency, which represents the frequency of attempts for a molecule to escape from adsorption site. It is directly linked to the oscillation frequency of the adsorbed molecules. The desorption flux is assumed to follow the empirical Arrhenius law. The value ΔFo is the desorption energy needed for a molecule to desorb. Writing the equilibrium between the two fluxes leads to
 (A.3)
(A.3)
where
 (A.4)
(A.4)
It is convenient to describe the adsorption isotherm with b as a unique parameter of the isotherm, as, for instance, in Curtis et al. (2008). However this hides the physical meaning of the adsorption isotherm and its physical parameters. The form given in this work, showing the physical description, allows us to relate the isotherm adsorption and the underlying physical parameters. Notably, the isotherm used in Pruppacher & Klett (1997) corresponds to nads∕nsite = δads∕δsite = bPx, that is, the first order description at Px = 0 of the Langmuir isotherm.
Appendix B Brunauer-Emmett-Teller isotherm
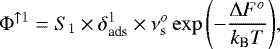
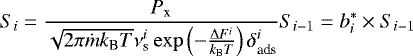
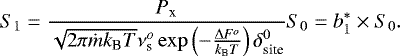
The BET adsorption model is associated with the adsorption isotherm of type II and III. The type III isotherm generally corresponds to cases with weak interaction between the gaseous molecules and the substrate, so adsorption of molecules on layers of already adsorbed molecules is easier than direct adsorption on the substrate. This model is based on the fact that molecules can be adsorbed on the substrate and also can be adsorbed on the molecules already adsorbed on the substrate, forming supplementary layers. The underlying physics behind the adsorption process is the same as for the Langmuir model. The layers are numbered from bottom to top with an index starting from i = 0 for the substrate itself. For the other layers, we assume that the molecules are stacked in organized horizontal layers where each molecule is located above the molecule of the layer below, as in a lattice. Therefore, in the vertical direction, the molecules are aligned in a column above an absorption site of the substrate. In this model, there is no need for the surface of a given level to be in one body. It can be patchy. The surface for the layer i, which is in contact with the free gas (that is which is at the top a column) is noted Si, and the number of available adsorption sites Si × δi, where δi is the surface density of adsorption site on the layer i. A new molecule can only be adsorbed at the top of the column.
The equilibrium of adsorbed molecules with the gaseous surrounding is reached when all the surfaces Si of all the layers are stable. We treat each layer as a population for which we can evaluate the gained or the lost surface due to adsorption or desorption of the layer i or of the adjacent layers i − 1 and i + 1. We discuss the main lines of the model and a full description can be found elsewhere (e.g., Lowell et al. 2004). To proceed, we have to compute for a given layer the gain and loss. The layer i increases its surface when a molecule is adsorbed by the layer i − 1 or when a molecule is desorbed from the layer i + 1. It decreases its surface when it adsorbs or desorbs a molecule. The gains and losses of adjacent layers are linked together because gains or losses for a given layer correspond to losses or gains for the adjacent layers. As for the Langmuir isotherm, the adsorption and desorption fluxes of a layer i are written as
 (B.1)
(B.1)
 (B.2)
(B.2)
where  and ΔFi are the jump frequency and the desorption energy of molecules adsorbed by the layer i, which is made of adsorbed molecules. For the first layer, we write
 (B.3)
(B.3)
 (B.4)
(B.4)
where  and ΔFo are the jump frequency and the desorption energy of molecules adsorbed on the solid substrate. We also note that the density of adsorbed molecules in the first layer,
  , is by definition equal to the density of sites on the solid substrate
  . Therefore, the gain Gi for the layer i comes from the adsorption of a molecule by the layer i − 1 or the desorption by the layer i + 1, that is,
 (B.5)
(B.5)
and the loss Li for the layer i comes from the adsorption or the desorption of a molecule by the layer i, that is,
 (B.6)
(B.6)
Then, we can write the time evolution of the layer i as  . For the layer i = 0 (that is the substrate itself), we write
  . At equilibrium, we have
  for all the layers. For the layer i = 0, G0 = L0 yields
 (B.7)
(B.7)
This equation is identical to the condition of the Langmuir isotherm. For the layer 1,  yields
 (B.8)
(B.8)
which, given the equilibrium equation of the first layer, becomes
 (B.9)
(B.9)
This equation can be used in  to obtain the equilibrium equation, and so on. We finally find the general condition that links all the values of Si together, that is,
 (B.10)
When we replace the fluxes by their physical descriptions as given above, we find for the layers i≠ 1,
 (B.11)
and for the layer i = 1,
 (B.12)
With this description, we assume that  is the same for all the layers i≠1 because they are made from the same material and, thus,
  , ΔFi and
  do not vary. We then note
  and
and  . Summing all the Si gives
 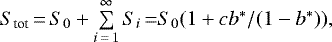 which is the total surface of the substrate. We also can sum the number of adsorbed molecules because we know that the surface Si is covered with a layer of i molecules, thus
 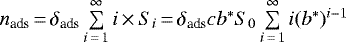 . We remark that
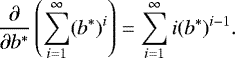 (B.13)
Knowing that 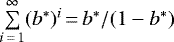 we then obtain
  . Finally, using the expression of Stot, we get
 (B.14)
where
 (B.15)
 (B.16)
and  (or, equivalently,
  ) is the BET adsorption isotherm. Generally, we assume that
  and
and  . ΔFo is the energy desorption from the substrate, and ΔFi is the energy desorption from the adsorbed phase, assumed to be close to the vaporization or sublimation latent heat Lv. This simple physical description allows us to relate the parameters c and b* to the physical parameters behind the BET adsorption law.
Although we use it for its convenience, we note that the BET isotherm is not devoid of biases owing to simplifications in the theoretical treatment. For instance, this theory neglects the lateral interactions between adsorbed molecules. It assumes uniform properties of the adsorbed medium (especially ΔFi) for all layers although the substrate could interfere and modify the properties in the lowermost layers. It assumes that adsorbed molecules are organized in regular stacks forming regular layers, while the medium constituted of adsorbed molecules could be more similar to a liquid phase with disorder in layers far enough from the substrate. And of course, the substrate itself may not be planar at microscopic scale.
References
- Atkins, P., & De Paula, J. 2006, Atkins’ Physical Chemistry (W.H. Freeman) (Oxford, UK: Oxford University Press) [Google Scholar]
- Bar-Nun, A., Kleinfeld, I., & Ganor, E. 1988, J. Geophys. Res., 93, 8383 [NASA ADS] [CrossRef] [Google Scholar]
- Barth, E. L., & Toon, O. B. 2003, Icarus, 162, 94 [NASA ADS] [CrossRef] [Google Scholar]
- Barth, E. L., & Toon, O. B. 2006, Icarus, 182, 230 [NASA ADS] [CrossRef] [Google Scholar]
- Brassé, C., Muñoz, O., Coll, P., & Raulin, F. 2015, Planet. Space Sci., 109, 159 [NASA ADS] [CrossRef] [Google Scholar]
- Carrasco, N., Schmitz-Afonso, I., Bonnet, J.-Y., et al. 2009, J. Phys. Chem. A, 113, 11195 [CrossRef] [Google Scholar]
- Carrasco, N., Tigrine, S., Gavilan, L., Nahon, L., & Gudipati, M. S. 2018, Nat. Astron., 2, 489 [NASA ADS] [CrossRef] [Google Scholar]
- Chen, S., Jin, L., & Chen, X. 2011, Procedia Eng., 26, 126 [CrossRef] [Google Scholar]
- Couturier-Tamburelli, I., Gudipati, M. S., Lignell, A., Jacovi, R., & Piétri, N. 2014, Icarus, 234, 81 [NASA ADS] [CrossRef] [Google Scholar]
- Couturier-Tamburelli, I., Piétri, N., & Gudipati, M. S. 2015, A&A, 578, A111 [NASA ADS] [CrossRef] [EDP Sciences] [Google Scholar]
- Couturier-Tamburelli, I., Piétri, N., Letty, V. L., Chiavassa, T., & Gudipati, M. 2018, ApJ, 852, 117 [NASA ADS] [CrossRef] [Google Scholar]
- Curtis, D. B., Glandorf, D. L., Toon, O. B., et al. 2005, J. Phys. Chem. A, 109, 1382 [CrossRef] [Google Scholar]
- Curtis, D. B., Hatch, C. D., Hasenkopf, C. A., et al. 2008, Icarus, 195, 792 [NASA ADS] [CrossRef] [Google Scholar]
- De Kok, R., Teanby, N., Maltagliati, L., Irwin, P., & Vinatier, S. 2014, Nature, 514, 65 [NASA ADS] [CrossRef] [Google Scholar]
- Dimitrov, V., & Bar-Nun, A. 2002, Icarus, 156, 530 [NASA ADS] [CrossRef] [Google Scholar]
- Dundar, E., Rogacka, J., Firlej, L., et al. 2016, Colloids Surf. A Physicochem. Eng. Asp., 496, 86 [CrossRef] [Google Scholar]
- Farris, H. N., Conner, M. B., Chevrier, V. F., & Rivera-Valentin, E. G. 2018, Icarus, 308, 71 [NASA ADS] [CrossRef] [Google Scholar]
- Fleury, B., Gudipati, M., Couturier-Tamburelli, I., & Carrasco, N. 2019, Icarus, 321, 358 [NASA ADS] [CrossRef] [Google Scholar]
- Fray, N., & Schmitt, B. 2009, Planet. Space Sci., 57, 2053 [NASA ADS] [CrossRef] [Google Scholar]
- Funk, J. E., & Dinger, D. R. 1994, Van der Waals Energy of Attraction (Boston, MA: Springer), 173 [Google Scholar]
- Garland, R. M., Wise, M. E., Beaver, M. R., et al. 2005, Atm. Chem. Phys., 5, 1951 [NASA ADS] [CrossRef] [Google Scholar]
- Gautier, T., Carrasco, N., Mahjoub, A., et al. 2012, Icarus, 221, 320 [NASA ADS] [CrossRef] [Google Scholar]
- Guan, C., Liu, S., Li, C., Wang, Y., & Zhao, Y. 2018, Fuel, 211, 241 [CrossRef] [Google Scholar]
- Gudipati, M., Jacovi, R., Couturier-Tamburelli, I., Lignell, A., & Allen, M. 2013, Nat. Commun., 4, 1648 [NASA ADS] [CrossRef] [Google Scholar]
- Guez, L., Bruston, P., Raulin, F., & Régnaut, C. 1997, Planet. Space Sci., 45, 611 [NASA ADS] [CrossRef] [Google Scholar]
- Gustafsson, R. J., Orlov, A., Badger, C. L., et al. 2005, Atm. Chem. Phys., 5, 3415 [NASA ADS] [CrossRef] [Google Scholar]
- Hadamcik, E., Renard, J.-B., Carrasco, N., et al. 2011, Atti della Accademia Peloritana dei Pericolanti, 89, 1 [Google Scholar]
- Himeno, S., Komatsu, T., & Fujita, S. 2005, J. Chem. Eng. Data, 50, 369 [CrossRef] [Google Scholar]
- Imanaka, H., Khare, B. N., Elsila, J. E., et al. 2004, Icarus, 168, 344 [NASA ADS] [CrossRef] [Google Scholar]
- Khare, B. N., Sagan, C., Arakawa, E. T., et al. 1984, Icarus, 60, 127 [NASA ADS] [CrossRef] [Google Scholar]
- Laaksonen, A. 2015, J. Phys. Chem. A, 119, 3736 [CrossRef] [Google Scholar]
- Larson, E. J. L., Toon, O. B., West, R. A., & Friedson, A. J. 2015, Icarus, 254, 122 [NASA ADS] [CrossRef] [Google Scholar]
- Lavvas, P., Griffith, C., & Yelle, R. 2011, Icarus, 215, 732 [NASA ADS] [CrossRef] [Google Scholar]
- Lebonnois, S., Burgalat, J., Rannou, P., & Charnay, B. 2012, Icarus, 218, 707 [NASA ADS] [CrossRef] [Google Scholar]
- Listowski, C., Määttänen, A., Riipinen, I., Montmessin, F., & Lefèvre, F. 2013, J. Geophys. Res. Planet, 118, 2153 [NASA ADS] [CrossRef] [Google Scholar]
- Lowell, S., Shields, J., Thomas, M., & Thommes, M. 2004, Characterization of Porous Solids and Powders: Surface Area, Pore Size and Density (Dordrecht, The Netherlands: Kluwer Academic Publishers) [CrossRef] [Google Scholar]
- Mahjoub, A., Carrasco, N., Dahoo, P.-R., et al. 2012, Icarus, 221, 670 [NASA ADS] [CrossRef] [Google Scholar]
- Michelangeli, D. V., Toon, O. B., Haberle, R. M., & Pollack, J. B. 1993, Icarus, 102, 261 [NASA ADS] [CrossRef] [Google Scholar]
- Montmessin, F., Rannou, P., & Cabane, M. 2002, J. Geophys. Res. Planet, 107, 4 [CrossRef] [Google Scholar]
- Moses, J. I., Allen, M., & Yung, Y. L. 1992, Icarus, 99, 318 [NASA ADS] [CrossRef] [Google Scholar]
- Navarro, T., Madeleine, J.-B., Forget, F., et al. 2014, J. Geophys. Res. Planet, 119, 1479 [NASA ADS] [CrossRef] [Google Scholar]
- Pruppacher, H. R., & Klett, J. D. 1997, Microphysics of Clouds and Precipitation, 2nd edn. (Dordrecht, The Netherlands: Kluwer Academic Publishers) [Google Scholar]
- Quirico, E., Montagnac, G., Lees, V., et al. 2008, Icarus, 198, 218 [NASA ADS] [CrossRef] [Google Scholar]
- Rannou, P., & West, R. 2018, Icarus, 312, 36 [NASA ADS] [CrossRef] [Google Scholar]
- Rannou, P., Hourdin, F., McKay, C., & Luz, D. 2004, Icarus, 170, 443 [NASA ADS] [CrossRef] [Google Scholar]
- Rannou, P., Perrier, S., Bertaux, J.-L., et al. 2006, J. Geophys. Res. Planets, 111, E09S10 [CrossRef] [Google Scholar]
- Rappe, A. K., Casewit, C. J., Colwell, K. S., Goddard, W. A., & Skiff, W. M. 1992, J. Am. Chem. Soc., 114, 10024 [CrossRef] [Google Scholar]
- Reid, R. C., Prausnitz, J. M., & Poling, B. E. 1988, The Properties of Gases and Liquids (New York: McGraw-Hill) [Google Scholar]
- Scattergood, T. W., Lau, E. Y., & Stone, B. M. 1992, Icarus, 99, 98 [NASA ADS] [CrossRef] [Google Scholar]
- Sciamma-O’Brien, E., Upton, K. T., & Salama, F. 2017, Icarus, 289, 214 [NASA ADS] [CrossRef] [Google Scholar]
- Seki, J., & Hasegawa, H. 1983, Ap&SS, 94, 177 [NASA ADS] [CrossRef] [Google Scholar]
- Thommes, M., Kaneko, K., Neimark, A. V., et al. 2015, Pure Appl. Chem., 87, 9 [CrossRef] [Google Scholar]
- West, R., Del Genio, A., Barbara, J., et al. 2016, Icarus, 270, 399 [NASA ADS] [CrossRef] [Google Scholar]
- Zotarelli, M. F., da Silva, V. M., Durigon, A., Hubinger, M. D., & Laurindo, J. B. 2017, Powder Technol., 305, 447 [CrossRef] [Google Scholar]
All Tables
All Figures
|
Fig. 1 Top: size distribution of the tholin grains in the experiment of Curtis et al. (2008). The solid lines correspond to the actual published data and the dashed lines correspond to an extrapolation made in this work to complete the distribution.Bottom: measured adsorption isotherms (ratio of adsorbed molecules relative to the number of adsorption sites) of methane and ethane on tholin as a function of the saturation ratio (Curtis et al. 2008). |
| In the text | |
|
Fig. 2 Adsorption isotherm of methane on tholin substrate. The blue dots show the number of adsorbed molecules scaled to the number of adsorption sites and the thick red line shows the isotherm obtained with ΔFo = 1.519 × 10⁻²⁰ J to match the Curtis et al. (2008) isotherm for methane (their Fig. 7). The other isotherms (thin red lines) are obtained with ΔFo = (1.519 ± 0.006) × 10−20 J. The vertical solid and dashed lines show the condensation threshold at S = 1.07 ± 0.008. |
| In the text | |
|
Fig. 3 Map of χ2 values as a function of α and c obtained by matching the parametrized BET isotherm (Eqs. (3)–(6)) and the experimental isotherm for ethane adsorption on tholin (Curtis et al. 2008). The best value is obtained for α = 9.05 × 10⁻¹² and c = 0.067. The second contour (blue) indicates the 2σ level. This contour is used to provide an idea of the uncertainties on the values of α and c, and further on the energy terms. |
| In the text | |
|
Fig. 4 Adsorption isotherm of ethane on tholin substrate. The blue dots show the isotherm obtained from experiment (Fig. 11 of Curtis et al. 2008) The thick red line shows the best match of the isotherm obtained with the BET theory (Fig. 3) and the thin red lines show the isotherms obtained with the extreme values of the 2σ confidence ellipse. The vertical solid and dashed lines show the condensation threshold at S = 1.36 ± 0.08. |
| In the text | |
|
Fig. 5 Variations of absorbance as functions of saturation for the modeled experiment with methane and ethane, for different values of the wetting coefficient and for the reference cases (see “REF” cases in Table 2). For each curve, the absorbance threshold 10−3 is reached at given saturation ratios. These modeled values are compared to the value Scrit found in the experiment by Curtis et al. (2008) and shown as red and blue boxes for methane and ethane, respectively. This allows us, for each gas, to constrain the wetting parameter m for which the value of absorbance reaches 10−3 when S = Scrit. The lower and upper limits of the boxes are set at half a decade below and above the reference threshold 10−3. |
| In the text | |
|
Fig. 6 Critical saturation ratio (at which condensation takes place) as a function of the wetting parameter in the numerical simulations reproducing Curtis et al. (2008) experiment. For both plots, the horizontal thick green line represents the observed critical saturation ratio and the green thin lines the upper and lower boundaries of the observed critical saturation due to standard deviation (Curtis et al. 2008). Left: results for methane are shown with the cases of linear isotherm used in Pruppacher & Klett (1997) (“PK”) and with the Langmuir isotherm (“LAN”). Right: results for ethane are shown with the linear isotherm (“PK”) and the BET isotherm (“BET”). For both plots, the label codes and model parameters are described in Table 2. |
| In the text | |
Current usage metrics show cumulative count of Article Views (full-text article views including HTML views, PDF and ePub downloads, according to the available data) and Abstracts Views on Vision4Press platform.
Data correspond to usage on the plateform after 2015. The current usage metrics is available 48-96 hours after online publication and is updated daily on week days.
Initial download of the metrics may take a while.