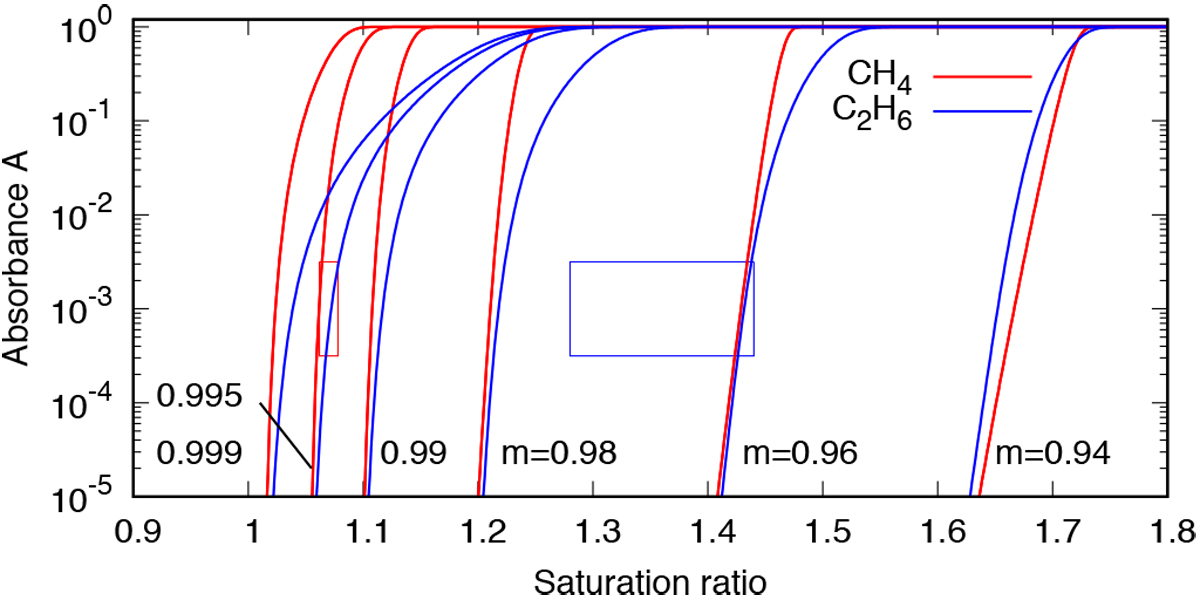
Fig. 5

Variations of absorbance as functions of saturation for the modeled experiment with methane and ethane, for different values of the wetting coefficient and for the reference cases (see “REF” cases in Table 2). For each curve, the absorbance threshold 10−3 is reached at given saturation ratios. These modeled values are compared to the value Scrit found in the experiment by Curtis et al. (2008) and shown as red and blue boxes for methane and ethane, respectively. This allows us, for each gas, to constrain the wetting parameter m for which the value of absorbance reaches 10−3 when S = Scrit. The lower and upper limits of the boxes are set at half a decade below and above the reference threshold 10−3.
Current usage metrics show cumulative count of Article Views (full-text article views including HTML views, PDF and ePub downloads, according to the available data) and Abstracts Views on Vision4Press platform.
Data correspond to usage on the plateform after 2015. The current usage metrics is available 48-96 hours after online publication and is updated daily on week days.
Initial download of the metrics may take a while.


