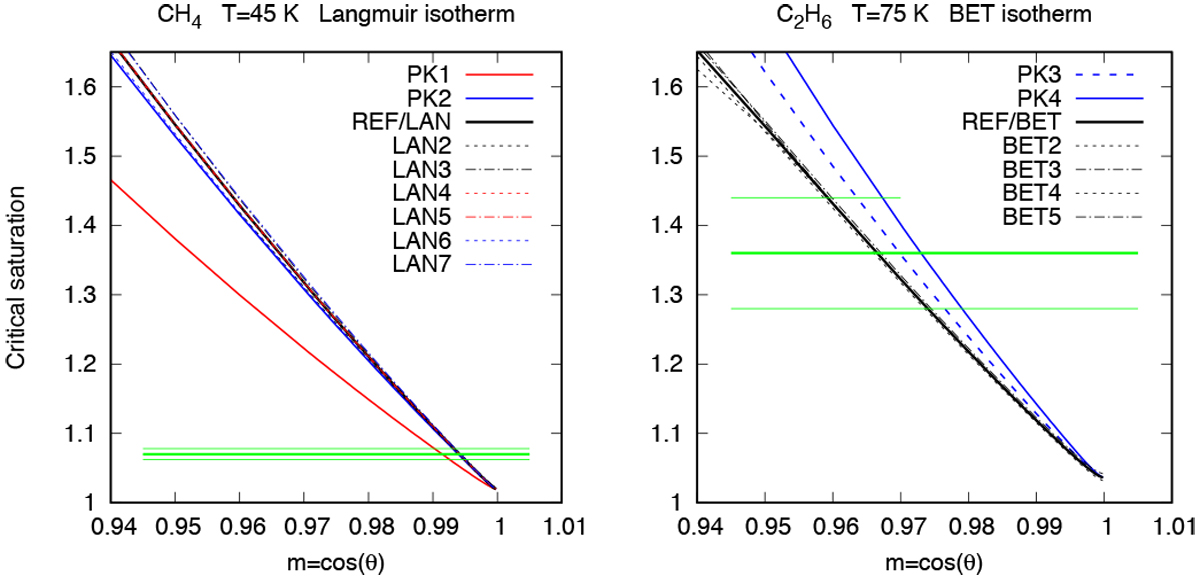
Fig. 6

Critical saturation ratio (at which condensation takes place) as a function of the wetting parameter in the numerical simulations reproducing Curtis et al. (2008) experiment. For both plots, the horizontal thick green line represents the observed critical saturation ratio and the green thin lines the upper and lower boundaries of the observed critical saturation due to standard deviation (Curtis et al. 2008). Left: results for methane are shown with the cases of linear isotherm used in Pruppacher & Klett (1997) (“PK”) and with the Langmuir isotherm (“LAN”). Right: results for ethane are shown with the linear isotherm (“PK”) and the BET isotherm (“BET”). For both plots, the label codes and model parameters are described in Table 2.
Current usage metrics show cumulative count of Article Views (full-text article views including HTML views, PDF and ePub downloads, according to the available data) and Abstracts Views on Vision4Press platform.
Data correspond to usage on the plateform after 2015. The current usage metrics is available 48-96 hours after online publication and is updated daily on week days.
Initial download of the metrics may take a while.


