| Issue |
A&A
Volume 631, November 2019
|
|
|---|---|---|
| Article Number | A116 | |
| Number of page(s) | 11 | |
| Section | Catalogs and data | |
| DOI | https://doi.org/10.1051/0004-6361/201935646 | |
| Published online | 01 November 2019 | |
Open Universe for Blazars: a new generation of astronomical products based on 14 years of Swift-XRT data⋆
1
Italian Space Agency, ASI, via del Politecnico snc 00133 Roma, Italy
e-mail: This email address is being protected from spambots. You need JavaScript enabled to view it.
2
Institute for Advanced Study, Technische Universität München, Lichtenbergstrasse 2a, 85748 Garching bei München, Germany
3
ICRANet, P.zza della Repubblica 10, 65122 Pescara, Italy
4
Jacobs University, Physics and Earth Sciences, Campus Ring 1, 28759 Bremen, Germany
5
Centro Brasileiro de Pesquisas Físicas, Rua Dr. Xavier Sigaud 150, 22290-180 Rio de Janeiro, Brazil
6
Department of Physics and Astronomy, University of Sheffield, Hounsfield Road, Sheffield S3 7RH, UK
7
New York University Abu Dhabi, Abu Dhabi, UAE
8
Institute of Physics. IFLP-CONICET, diag 113, e/63-64.(1900) La Plata, Argentina
9
Department of Physics, University of La Plata, 49 and 115.C.C.67, 1900 La Plata, Argentina
10
Space Science Data Center, SSDC, ASI, via del Politecnico snc, 00133 Roma, Italy
11
United Nations Office for Outer Space Affairs, UNOOSA, Vienna, Austria
12
INAF – Osservatorio Astronomico di Roma, via Frascati 33, 00040, Monteporzio Catone, Italy
13
Dipartimento di Matematica e Fisica, Università degli studi Roma Tre, Via della Vasca Navale 84, 00146 Roma, Italy
14
ICRANet-Armenia, Marshall Baghramian Avenue 24a, Yerevan 0019, Armenia
15
Computational Astrophysics Laboratory – RIKEN, 2-1 Hirosawa, Wako, Saitama 351-0198, Japan
Received:
9
April
2019
Accepted:
18
July
2019
Abstract
Aims. Open Universe for Blazars is a set of high-transparency multi-frequency data products for blazar science, and the tools designed to generate them. Blazars are drawing growing interest following the consolidation of their position as the most abundant type of source in the extragalactic very high-energy γ-ray sky, and because of their status as prime candidate sources in the nascent field of multi-messenger astrophysics. As such, blazar astrophysics is becoming increasingly data driven, depending on the integration and combined analysis of large quantities of data from the entire span of observational astrophysics techniques. The project was therefore chosen as one of the pilot activities within the United Nations Open Universe Initiative, whose objective is to stimulate a large increase in the accessibility and ease of utilisation of space science data for the worldwide benefit of scientific research, education, capacity building, and citizen science.
Methods. Our aim is to deliver innovative data science tools for multi-messenger astrophysics. In this work we report on a data analysis pipeline called Swift-DeepSky based on the Swift XRTDAS software and the XIMAGE package, encapsulated into a Docker container. Swift-DeepSky downloads and reads low-level data, generates higher level products, detects X-ray sources, and estimates several intensity and spectral parameters for each detection, thus facilitating the generation of complete and up-to-date science-ready catalogues from an entire space-mission data set.
Results. As a first application of our innovative approach, we present the results of a detailed X-ray image analysis based on Swift-DeepSky that was run on all Swift-XRT observations including a known blazar, carried out during the first 14 years of operations of the Neil Gehrels Swift Observatory. Short exposures executed within one week of each other have been added to increase sensitivity, which ranges between ∼1 × 10⁻¹² and ∼1 × 10⁻¹⁴ erg cm−2 s−1 (0.3–10.0 keV). After cleaning for problematic fields, the resulting database includes over 27 000 images integrated in different X-ray bands, and a catalogue, called 1OUSXB, that provides intensity and spectral information for 33 396 X-ray sources, 8896 of which are single or multiple detections of 2308 distinct blazars. All the results can be accessed online in a variety of ways, from the Open Universe portal through Virtual Observatory services, via the VOU-Blazar tool and the SSDC SED builder. One of the most innovative aspects of this work is that the results can be easily reproduced and extended by anyone using the Docker version of the Swift-DeepSky pipeline, which runs on Linux, Mac, and Windows machines, and does not require any specific experience in X-ray data analysis.
Key words: galaxies: active / X-rays: galaxies / methods: data analysis / catalogs
The Docker version of the pipeline, whose concept can be reproduced with other missions, and its derived products is publicly available from the Open Universe Website (http://openuniverse.asi.it).
© ESO 2019
1. Introduction
Providing open and transparent access to scientific data is a social obligation of the scientific community, and central to the progress of research in the era of big data and of data-driven science. Facilitated access to scientific data can also play a critical role in education, capacity building, and in the promotion of citizen science. For this reason the United Nations has recognised that free access to space-science data is a strategic objective contributing to the achievement of the Sustainable Development Goals (SDGs)1.
In the field of astronomy, the third United Nations Conference on the Exploration and the Peaceful Uses of Outer Space, UNISPACE III, requested that action be taken to improve the scientific knowledge of near and outer space by promoting cooperative activities in such areas as astronomy, space biology and medicine, space physics, the study of near-Earth objects, and planetary exploration. This request is echoed in Open Universe.
Open Universe2 (Giommi et al. 2018) is an initiative proposed by Italy to the United Nations Committee on the Peaceful Uses of Outer Space (COPUOS) in 20163 that is now being actively developed by a number of countries in coordination with the UN Office for Outer Space Affairs (UNOOSA). Its main goal is to contribute to making astronomy and space-science data more openly available; easily discoverable; free of bureaucratic, administrative, or technical barriers; and therefore usable by the widest possible community, from professional researchers to all people interested in space science. To this end, Open Universe aims to support an increase in productivity of space research, facilitate the emerging field of data-driven science, and stimulate a significant acceleration towards the democratisation of space science.
Open access to scientific data, and the associated technologies, has been actively addressed by a number of initiatives working in complementary ways, such as the International Virtual Observatory Alliance (IVOA)4, the European Open Science Cloud (EOSC)5, the Research Data Alliance (RDA)6, the Astronomy ESFRI, and Research Infrastructure Cluster (ASTERICS)7, among others.
Starting from different angles and approaches, these various initiatives propose and develop solutions to support the reuse of astrophysical data, following general concepts that are now commonly accepted and widely endorsed, for example in the FAIR Guiding Principles for Scientific Data Management and Stewardship (Wilkinson et al. 2016) and in the particular application of the FAIR principles in astronomy and space science (Pollock 2018).
The Open Universe Initiative emphasises that open data by itself does not equal data transparency, which in our view requires compliance with all of the following criteria: a) satisfying the FAIR principles; b) optimising the scientific and sociological value of the data; c) providing access via the simplest possible interfaces; and d) requiring no additional processing.
In line with this general vision and, in particular, with the democratisation of science and its potential as a tool for development, Open Universe can contribute to offering accessible space science data that can be used by anyone, and that can be flexibly employed in different applications from research to education, thus responding to the global demand for transparency of all goods produced through public funding. Currently the operational part of Open Universe can be accessed through its data portal8, which acts as a window to web-based initiatives collecting data. The portal also provides a few additional online functions for smart, purpose-built data mining and data visualisation, such as the Virtual Observatory based Open Universe tools, VOU-Blazars and VOU-SED. The Initiative, however, is not limited to these services, but aims to the continuous development of new data products and data-oriented solutions. It is open to collaboration with all countries and institutions sharing our views on data transparency and open science, and willing to participate in activities to increase the reach of astronomical data sets, and lower the technical complexity required to work with them.
As a concrete application of this view, we present Open Universe for Blazars, a project devoted to the generation of transparent scientific products from multi-frequency astronomical data by the Neil GehrelsSwift Observatory (Gehrels et al. 2004, hereafter Swift) and other astronomy satellites. This first project, developed as a pilot activity within the Initiative, focuses on blazars, astrophysical sources that are receiving increased attention as they are expected to abound in upcoming very high-energy (VHE) γ-ray sky surveys9,10. In addition, blazars will likely play a crucial role in the nascent field of multi-messenger astrophysics, following their recent potential association with astrophysical high-energy neutrinos and ultra high-energy cosmic rays (UHECRs, e.g. IceCube Collaboration et al. 2018; Resconi et al. 2017)
The multi-messenger and big data characteristics of blazar research motivated the project as a test-bed for the incorporation of novel computational technologies to increase data transparency and usability. To that end, we pioneered the combination of Virtual Observatory services with Linux containers to provide enhanced accessibility to top-quality, reliable scientific data products on demand, with minimum recourse to mission-specific data reduction techniques or computational knowledge by the user.
Linux Containers, and in particular the implementation by Docker, Inc.11, provide a portable solution for shipping software. As shown below, this technology is suitable for a safe and robust distribution of ready-to-use complex astronomical data analysis packages, with a simple user interface, removing the need for a high degree of specialised knowledge that would otherwise be required. This in turn opens the way to a number of flexible applications, such as distributed and web-based intensive data analysis, mobile-compatible operation, and improved usability by non-experts for purposes of science, education, or citizen science.
2. Blazars and the Swift Observatory
Blazars are a special and uncommon type of active galactic nucleus12 (AGN, Padovani et al. 2017), distinguished by the emission of highly variable radiation across the entire electromagnetic spectrum. It is commonly accepted that a large part of this radiation is generated by charged particles within a jet of material that moves away at relativistic speeds from the central supermassive black hole and happens to be pointing in the direction of the Earth (see e.g. Urry & Padovani 1995; Romero et al. 2017).
Blazars come in two subclasses, flat-spectrum radio quasars (FSRQs) and BL Lacertae objects (BL Lacs), depending on their optical spectra: FSRQs show broad emission lines just like normal quasi-stellar objects (QSOs), while BL Lacs instead display at most weak emission lines, sometimes exhibit absorption features, and in many cases are completely featureless. The observational appearance of blazars depends on a complex mix of physical and geometrical conditions, and their classification is subject to selection effects (Giommi et al. 2012a).
The spectral energy distribution (SED), a plot of the νf(ν) flux as a function of frequency ν, of blazars has been studied in ever growing detail since the early days of multi-frequency astronomy (see e.g. Cruz-Gonzalez & Huchra 1984; Giommi et al. 1995; Fossati et al. 1998; Ghisellini et al. 1998, showing that it covers the entire electromagnetic spectrum and is characterised by a double-humped shape (see Fig. 1 in Padovani et al. 2017 or Fig. 5 and Fig. 7 below). The low-energy component, peaking between the IR and the X-ray band, is generally attributed to synchrotron radiation produced by relativistic electrons moving in a magnetic field. The second component extends well into the γ-ray band, and is typically explained as either inverse Compton scattering of the electrons against photons, or other radiation mechanisms involving hadronic scenarios and neutrino emission.
Even though they are much less common than other types of AGN, the particular radiation processes that cause blazars to emit across the entire electromagnetic spectrum and the particular geometrical circumstances that cause strong flux amplification make these objects the most common type of extragalactic source so far detected in the microwave and γ-ray skies (Giommi & Colafrancesco 2004; Acero et al. 2015; Ackermann et al. 2015). Blazars have often been associated with high-energy astrophysical neutrinos (e.g. Mannheim 1995; Atoyan & Dermer 2003; Tavecchio et al. 2014; Rodrigues et al. 2018; Padovani et al. 2018) and possibly with UHECRs (e.g. Resconi et al. 2017). For the same reason, blazars are expected to be found in large numbers in the high-energy extragalactic sky that will soon be surveyed by the new generation of powerful VHE observatories such as CTA, HAWK, or LHAASO, and will likely play a crucial role in the emerging field of multi-messenger astrophysics.
Blazar research has always been central to the scientific programme of the Swift observatory (Gehrels et al. 2004), which is a NASA mission launched on November 20, 2004 and still fully operational. The Swift hardware and software were built by an international collaboration involving the United States, Italy, and the United Kingdom. The original main scientific driver of the Swift mission was to detect gamma-ray bursts (GRBs) in the hard X-ray band with the Burst Alert Telescope (BAT, Barthelmy et al. 2005), and quickly follow up their emission at longer wavelengths with the X-Ray Telescope (XRT, Burrows et al. 2005), and the Ultraviolet/Optical Telescope (UVOT, Roming et al. 2005). Although specifically designed to carry out GRB science, Swift has proven to be an extremely effective multi-purpose multi-frequency observatory. During its first 14 years of operations the satellite carried out over 24 000 pointings13 of approximately 2600 catalogued blazars, for a total of 44.6 Ms of XRT net exposure time, corresponding to ≈14% of the entire mission scientific programme. The XRT is an X-ray telescope with a CCD at its focus that is normally operated in either of two readout modes, Photon Counting (PC) mode, which provides full imaging and spectral information, routinely used to observe targets that are faint or moderately bright X-ray sources, and Windowed Timing (WT) mode, which does not provide full imaging information and is used to measure the X-ray spectrum and the time variability of sources brighter than ≈2 × 10⁻¹¹ erg cm−2 s−1 in the 0.3–10.0 keV band.
Figure 1 plots the amount of XRT exposure time dedicated to observations of blazars in PC mode during the first 14 years of Swift operations. The distribution of exposure times of individual XRT pointings, each characterised by an 11-digit unique identifier called Observation_ID (OBS_ID) or sequence number, ranges from a few hundred seconds to about 10 ks, with a clear peak at 1 ks (see Fig. 2).
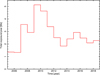 |
Fig. 1. Distribution of XRT exposure time in PC mode dedicated to known blazars over the 14 years of Swift mission operations covered in this work. |
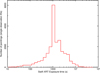 |
Fig. 2. Distribution of Swift exposure times of single OBS_ID pointings where the XRT field of view includes a known blazar. There is a strong peak at 1 ks. |
All Swift data immediately enter the public domain and are openly available to anyone. The official Swift archives provide access to low- and intermediate-level data products together with complex reduction and analysis software and calibration files, designed to be used by experienced scientists to conduct higher level data processing. To benefit fully from the Swift data, non-experts in the field would have to go through a learning process that most people cannot afford. Even professionals may have significant problems if they have no direct experience with X-ray data analysis or need to analyse large amounts of data.
Following the directives of data transparency described in the previous section, the work presented here builds on the public domain data provided by Swift to deliver science-ready, high-level products for the instrument’s entire blazar catalogue, increasing access to a larger number of potential users. This work is meant to be a concrete example of how the Open Universe Initiative can contribute to creating effective solutions to data accessibility. These efforts in turn hold a potential impact for research in various sectors of astrophysics and space science, and in the development of new, more user-oriented applications.
3. Master list of blazars
Most blazars known to date have been found in radio, X-ray, or γ-ray surveys, or through multi-frequency searches, with a discovery rate that has been steadily increasing over the last several years. For this reason no recent complete lists exist. To assemble a reasonably up-to-date comprehensive catalogue of blazars we combined the BZCAT 5th edition (Massaro et al. 2015), the list of blazars in the Fermi 3LAC catalogue (Ackermann et al. 2015), and the recently released 3HSP list of high-energy peaked and extreme blazars, which includes 2011 objects, and is expected to have a contamination fraction from non-blazar sources that is significantly less then 4% (Chang et al. 2019).
The resulting master list14 includes 5340 distinct blazars, 3561 of which are from BZCAT, 1353 are sources in the 3HSP catalogue that are not included in BZCAT, and the remaining objects are 3LAC blazars that are not listed in the BZCAT or the 3HSP catalogue. The number of blazars in the master list might seem large since only 20 years ago just a few hundred blazars were known. However, the comparison with the almost two million catalogued QSOs (see the Million Quasars Catalog, MILLIQUAS V5.7; Flesch 2015)15 gives a clear measure of how rare blazars are compared to other AGN. Even so, blazars are almost the only type of extragalactic source detected so far in the high-energy γ-ray band, reflecting their highly energetic and extreme nature.
To determine how many blazars have been observed by Swift during its first 14 years of orbital operations, we cross-matched our master catalogue of blazars with the list of all Swift-XRT observations carried out before December 31, 2018, About 50% of the blazars in our master list (2633 objects) are within the field of view of at least one XRT observation. If we consider only pointings carried out in PC mode with exposure of at least 200 s, this number reduces to 2585.
While most blazars have been observed just once or a few times, several have been observed repeatedly, over 1000 times for the case of MRK 421 (in PC or WT mode), for a total of approximately 18 000 XRT exposures in PC mode. For technical reasons Swift observations of a given target are frequently split into short exposures (corresponding to single OBS_ID, typically of 1 ks each, see Fig. 2) repeated over a period of a few days, until the requested exposure time is reached. In an effort to represent the originally requested exposure times, typically between 3 and 10 ks, and to increase sensitivity, rather than single snapshots or OBS_IDs we merged into a single “observation” all the exposures carried out within one week of each other. This merging procedure reduced to 11 399 the number of observations of blazars to be processed as described in the next paragraph.
4. Data processing
To perform a detailed Swift-XRT image analysis of the blazars in the sample described above, we developed a software pipeline called Swift-DeepSky (Brandt et al., in prep.) building on the Swift X-Ray Telescope Data Analysis Software (XRTDAS), designed and developed under the responsibility of the Space Science Data Center (SSDC) of the Italian Space Agency (ASI) and distributed within the NASA HEASoft16 software package and related XRT calibration files (CALDB)17. For a description of the Swift-DeepSky software see Appendix A.
The processing of all the 11 399 one-week co-added Swift XRT PC mode observations of the blazars described in Sect. 3 led to the detections of approximately 51 000 X-ray sources, including blazars (both observed as targets of Swift observations and as serendipitous sources), other Swift targets, and a large number of serendipitous sources.
Some of the blazars observed by Swift are located in complex regions of the X-ray sky, where significant extended X-ray emission is present. These might be fields that include bright clusters of galaxies or that suffer from residual contamination due to bright Earth, that is, radiation reflected by the atmosphere when Swift points close to the Earth limb. These fields can be very complex and certainly difficult to analyse in an automatic way or by inexperienced users. To remove this problem we applied a cleaning procedure that consists of two checks:
1. Background intensity consistent with expectations. All fields where the measured background was found to be larger than 4σ compared to the average image background observed in all fields in the sample were flagged out.
2. Number of detected point sources consistent with X-ray LogN–LogS. A 80 × 80 pixels sensitivity map based on local exposure, vignetting, and background was built. This map and the LogN–LogS of Mateos et al. (2008) were used to calculate the expected number of cosmic extragalactic sources in the field. All X-ray images where the number of detected sources deviated by more than 4σ from the expectations were flagged out.
This procedure lead to the identification of 353 observations (∼3% of the total) that suffer from significant background or apparent point source excesses. All sources detected in these fields, including 74 blazars, were removed from the final sample.
This process led to a “clean” sample including a total of 33 396 X-ray sources, with 8896 detections of 2308 distinct blazars comprising 770 FSRQs, 1276 BL Lacs, and 262 blazars of uncertain type. The remaining 24 500 detections in the sample are serendipitous X-ray sources (mostly radio quiet AGN) or targets of XRT observations where one of the blazars in our reference list was detected as a serendipitous source.
Figure 3 plots the observed count rate in the 0.3–10.0 keV band against exposure time of all the sources in the clean sample showing FSRQs, BL Lacs, and other targets and serendipitous sources. The dotted horizontal line marks the count-rate limit above which pileup18 becomes significant in sources observed in PC mode, causing significant flux underestimation and spectral distortion.
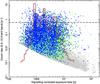 |
Fig. 3. Count rate in the 0.3–10.0 keV band vs the vignetting-corrected exposure time for all the sources detected in the data set considered. FSRQs: blue points; BL Lacs: green points; other targets and serendipitous sources: light grey points. The dotted horizontal line marks the count-rate limit above which pileup problems become significant in data taken in PC mode. The red histogram represents the number of blazars in each time bin, showing three peaks at approximately 1, 2, and 4–5 ks, the preferred exposure times for blazars. |
As can be seen in Fig. 3, most blazars are detected well above the minimum detectable count rate, and therefore with good statistics, as in most cases they were the target of the Swift observation. The red histogram overlaid on the plot represents the number of blazars included in each time bin. Three peaks at approximately 1, 2, and 4–5 ks are clearly visible, reflecting the Swift preferred exposure times for blazars.
The following scientific data products that match the operational definition of transparency given in the Introduction are available.
1. A catalogue of XRT point sources called 1OUSXB, including the following:
– Count rates and X-ray fluxes in the 0.3–10.0 keV (full band), 0.3–1.0 keV (soft band), 1.0–2.0 keV (medium band), and the 2.0–10.0 keV (hard band).
– Three-sigma upper limits when a source is not detected in the soft, medium, or hard energy band.
– Three independent νf(ν) flux measurements, de-absorbed to correct for Galactic absorption, and suitable for SED plotting, calculated at 0.5, 1.5, and 4.5 keV, from the count rates observed in the soft, medium, and hard energy bands. These νf(ν) fluxes are available within the VOU-Blazars (Chang et al., in prep.) and the SSDC-SED19 tools.
– Power-law energy slope and one-sigma statistical error, estimated from the hardness ratio, defined as (soft+medium band)/(hard band), only for sources detected with at least ≈50 net counts), and from a least-squares fit to the νf(ν) fluxes at 0.5, 1.5, and 4.5 keV.
– A 3.0 keV νf(ν) flux point based on the count rate in the full band.
– A νf(ν) flux at 1.0 keV, interpolated between the fluxes at 0.5 and 1.5 keV, suitable for light curve comparison with other X-ray satellites at the reference energy of 1.0 keV.
3. X-ray images in the full, soft, medium, and hard energy bands. These images are provided in GIF format for easy inspection.
4. Co-added events files and associated vignetting-corrected exposure maps.
5. A ready-to-use Docker version of the Swift-DeepSky pipeline software, and the open-source version.
The results and data products are available in a variety of ways and formats: (i) as FITS and CSV formatted tables; (ii) as online interactive tables that, in addition to the parameters included in the FITS catalogue, give access to products such as images; (iii) as SED spectral data accessible via the VOU-SED and the SSDC SED tools, all of which are available from the Open Universe portal20; (iv) through a web query interface21, and via Virtual Observatory services22. The table is also published through an IVOA cone search service (SCS23) and database graphical query interface provided by DaCHS24 (Demleitner et al. 2014).
In addition, full radio to γ-ray SEDs for each blazar, including the data of the results presented here, can be generated from the Open Universe web portal20. Note that all the data products generated for the observations integrated over one week are also available for these shorter exposures.
A few bright and highly variable objects have been monitored by Swift-XRT, particularly during flares, with short observations performed on a daily basis. To avoid losing possible daily X-ray variability that was the objective of the frequent rate of observations for these sources, we ran the Swift-DeepSky pipeline using a time interval of 1 day. The list of these intensely observed blazars and the total number of observations for each object is given in Table 1, where Col. 1 is the source name, Col. 2 is the number of XRT PC mode observations in one day with exposures longer than 200 seconds, Col. 3 is the number of detections free of pileup, Col. 4 is the 0.3–10.0 keV median count rate, and Col. 5 is the 0.3–10.0 keV median absolute deviation about the median as a variability measure.
Blazars observed by Swift with short and frequent, mostly daily XRT exposures in PC mode.
Details of the content of the 1OUSXB table in FITS format.
Some well-known blazars, such as MRK 421, MRK 501, and 3C 454.3, that have been monitored by Swift do not appear in Table 1 since their X-ray fluxes are so high that the Swift-XRT observations were mostly made in WT mode. Even when PC mode observations are available in the archive, they are very often subject to serious pileup. Detailed flux measurements, spectra and other high-transparency data products for these blazars will be published in a future paper presenting a systematic spectral analysis of WT and PC Swift-XRT data of blazars (see Giommi 2015, for preliminary results) using the XSPEC package (Arnaud 1996).
5. Results: some examples
In this section we give some examples of the content of our catalogue and related data, and of how it can be used for multi-frequency, time variability, and multi-messenger analysis.
5.1. Sensitivity range
Figure 4 plots the observed 0.3–10.0 keV energy flux versus exposure time, showing that the sensitivity of the Swift-XRT data set considered ranges from ∼10−12 erg cm−2 s−1 for the very shortest (∼200 s) exposures to ∼7 × 10⁻¹⁵ erg cm−2 s−1 for exposures as long as ∼105 s. Sources detected with a 0.3–10.0 keV count rate higher than 0.6 cts s−1 are affected by pileup and are not plotted in this figure. For this reason the maximum flux in the sample of sources not flagged as being affected by pileup is limited to ∼2 − 4 × 10⁻¹¹ erg cm−2 s−1, depending on the spectral slope and the amount of absorption in the Galaxy. This range of sensitivities is intermediate between that of the sources in the catalogue of D’Elia et al. (2013), who only considered single OBS_IDs, and the lists of Evans et al. (2014) and Puccetti et al. (2011), who instead stacked all the XRT data available.
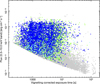 |
Fig. 4. 0.3–10.0 keV band flux vs vignetting-corrected exposure time for all detected sources free of pileup in PC mode (count rate< 0.6 cts s−1). Colour–coding as in Fig. 3. |
5.2. Energy (SEDs) and time domain (light curves) plots
Figure 5 shows the SED of BL Lacertae, the prototypical object of the blazar class. The grey points are non-simultaneous multi-frequency archival data showing the typical double-humped SED and large flux variations. The red points are 0.5, 1.5, 3.0, and 4.5 keV νf(ν) measurements from our catalogue. They show a hard spectrum and a factor of ∼10 intensity variability, the details of which are shown in Fig. 6 where the 0.3–10 keV X-ray flux (top panel) and the energy spectral slope (bottom panel), are plotted as a function of observation date.
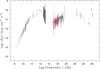 |
Fig. 5. Spectral energy distribution of BL Lacertae. The grey points are archival multi-frequency data. The red points are from this work. |
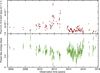 |
Fig. 6. History of the 0.3–10.0 keV band flux and estimated power-law energy spectral slope of BL Lacertae. |
Figure 7 shows the SED of OJ 287, a blazar where the two SED components meet in the middle of the XRT energy band. The green points are spectral data obtained from the first XSPEC spectral analysis of all the XRT data in PC and WT mode that was run on a subsample of bright blazars in 2015. The red points from this work do not reach the highest fluxes because of pileup problems above the count rate of 0.6 ct s−1. The top panel of Fig. 8 shows how the low-energy flux (0.5 keV) at the end of the first SED component varies in a different way from the flux at 4.5 keV (middle panel), which belongs to the high-energy SED component. The variation in the spectral slope is shown in the bottom panel.
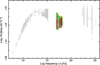 |
Fig. 7. Spectral energy distribution of the blazar OJ 287. The grey points are archival multi-frequency data. The red points are from this work (data in PC mode and count rate < 0.6 cts s−1). The green points are XSPEC spectra from the first analysis of all the XRT data in PC and WT mode run on a small subsample of blazars (Giommi 2015). |
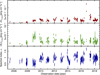 |
Fig. 8. νf(ν) flux at 0.5, 4.5 keV and the power-law energy spectral index of the blazar OJ 287 are plotted against observation date. Many differences in the top and middle panels are clearly visible; in particular, the X-ray flares occur in different periods in the soft (0.5 keV) and hard (4.5 keV) parts of the X-ray spectrum. |
5.3. Blazar TXS 0506+056: a likely source of IceCube neutrinos
One way to illustrate the reliability of our database is to compare our results to those published by independent authors using the same data set. We consider here the case of TXS 0506+056, the blazar that has been recently, and for the first time, associated with several IceCube neutrinos, and in particular with the high-energy neutrino IC170922. This source was observed by Swift a few hours after the neutrino arrival, and has been frequently monitored in the weeks after the IceCube event.
A complete analysis of the first two months of the Swift-XRT monitoring of TXS 0506+056 has been reported by Keivani et al. (2018). Figure 9 plots the 0.3–10.0 keV and 2–10 keV bands, and the power-law photon index of this blazar as a function of time, based on the content of our database which, we recall, was built in a completely automated way and could have been produced by any user with the Swift-DeepSky Docker container. A detailed comparison of this figure with Fig. 2 and Table 1 of Keivani et al. (2018) clearly shows that our results are essentially identical to those of Keivani et al. (2018). We note that Fig. 9 shows the flux in the full band (red points in the upper panel) reported by Keivani et al. (2018) in addition to the flux in the hard 2–10 keV band (green points in the middle panel). We did this to show that the maximum source intensity in the two energy bands occurs at different times: immediately after the arrival of the neutrino in the hard band, when the spectrum was hardest, and at a later time in the full 0.3–10.0 keV band.
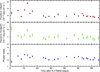 |
Fig. 9. 0.3–10.0 keV and 2–10 keV band flux in units of 10−12 erg cm−2 s−1 (top and middle panel), and the power-law photon index of TXS0506+056 (bottom panel) are plotted as a function of time. All uncertainties are given at 1σ. |
5.4. Some population statistical properties
Figure 10 shows the distributions of the power-law energy spectral indices in the subsamples of FSRQs, BL Lacs, and QSOs with no radio detection in the MILLIQUAS catalogue (Flesch 2015), that have been serendipitously detected in our X-ray images. The distributions are clearly distinct, reflecting the different ranges of synchrotron peak energies of the SED components in FSRQs and BL Lacs (see e.g. Giommi et al. 2012b,a) and the different X-ray emission process in radio-quiet QSOs that is due to accretion onto the super-massive black hole, rather than non-thermal emission from a relativistic jet. The spectral index distribution in sample of QSOs with no radio emission peaks at ∼0.8, as expected in sources of this type (e.g. Comastri et al. 1995).
 |
Fig. 10. Distribution of the power-law energy spectral index in the subsamples of FSRQs (top), BL Lacs (middle), and radio quiet QSOs (bottom). |
Finally, Fig. 11 illustrates the difference between the redshift distributions of FSRQs with hard (α < 0.5, solid red histogram) and with steeper (α > 0.5, dotted black histogram) X-ray spectral slopes. A Kolmogorov–Smirnov test gives a probability of ∼2 × 10⁻⁷ that the two distributions come from the same parent population. There could be different reasons why the hard sources are statistically observed at higher redshifts, including the following:
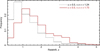 |
Fig. 11. Redshift distribution of FSRQs with different power-law spectral indices (α). The black dotted histogram refers to objects with α > 0.5, while the red solid histogram is for sources with α < 0.5. FSRQs with flat spectral slopes tend to have higher redshifts. |
– a spectral hardening at energies above 10 keV that enters the XRT energy band (0.3–10.0 keV) only for high-redshift sources;
– a dependence of the X-ray spectral slope on luminosity, with the high-redshift and more powerful FSRQs showing the hardest spectra;
– the X-ray spectrum is the result of the superposition of two components, one that is relatively soft (α ∼ 0.8) due to accretion onto the super-massive black hole, and a second much harder one that is due to the inverse-Compton emission from the jet. At relatively high energies (E ≳ 10 keV) the hard component starts dominating the spectrum, which is red-shifted into the 0.3–10 keV XRT band for high-redshift sources.
A detailed statistical study is needed to distinguish among the various possibilities.
5.5. Comparison with previous Swift-XRT catalogues
Other catalogues of point-like X-ray sources detected in Swift-XRT images have been published in the past, e.g. Puccetti et al. (2011), D’Elia et al. (2013) and Evans et al. (2014). In addition to the coverage extension from 8 to 14 years of Swift observations, the approach followed in this paper is different in several ways:
– It has been designed to make all scientific products easily and readily accessible, in a number of ways, for example through virtual observatory (VO) access, the Open Universe portal, and via SED tools.
– It demonstrates the possibility to extend the access to X-ray data analysis and space science data in general to non-experts, in principle to anyone interested in the field.
– It has been designed to support present and future gamma-ray surveys, in the context of the emerging field of multi-messenger astrophysics, by providing suitable blazar data from the most extensive X-ray mission of its kind. Scientific applications of this data set could include (a) help in the identification of HE and VHE γ-ray sources, high-energy neutrinos, and possibly UHECRs astrophysical counterparts; (b) support in the selection of targets for VHE γ-ray observations; and (c) multi-temporal X-ray data suitable for the construction of time dependent SEDs to be compared to physical models.
6. Open Universe for blazars: future developments
We intend to extend the work presented in this paper to other multi-frequency data on blazars. The following is a preliminary list of activities planned to be carried out in the coming months.
The Swift-XRT data of blazars with more than 50 net counts in our database (about 1000 objects), as well as all XRT data of bright blazars taken in both WT readout mode, will be processed by means of an extended pipeline that takes into account and corrects for pileup problems, and generates X-ray spectra using the XSPEC package (Arnaud 1996). Early results from a test run of this processing carried out on a small subset of very bright X-ray blazars have been reported in Giommi (2015). A similar procedure will be followed to analyse all public observations of blazars carried out with the hard X-ray observatory NuSTAR (Harrison et al. 2013).
Transparent-level results (νf(ν) spectra with ten energy points) and high-level data products like Pulse Height Amplitude (PHA) spectra and response files will also be made available in a number of ways including VOU-Blazars, the SSDC SED tool, and other services available within the Virtual Observatory (VO) and the Open Universe portal.
As part of the Open Universe for blazars project we are also producing, and will soon make available, Swift BAT spectra of the brightest X-ray blazars and a set of adaptive-bin gamma-ray light curves from Fermi-LAT data. They will be accessible, as with the other products, from the Open Universe portal, the VOU-Blazars, and the SSDC SED tools, as well as via VO services. The temporal and spectral information will be combined to generate SED movies similar to those published in Padovani et al. (2018) and Giommi (2015), which are available online25.
One of the practical challenges in the provision of open data services in astronomy, especially when theses services involve operational satellites and aim to deliver high-level products in a timely manner, is keeping the information up-to-date and conforming to the latest versions of the data analysis software and calibration files. Despite the practical difficulties involved in achieving this, such standards constitute an important step towards improving data transparency and in democratising the accessibility to the best quality scientific data available.
By taking advantage of new software technologies, it is possible today to minimise the shortcomings. In the current application of Open Universe for Blazars we have been able to use Linux containers based on Docker technology to test a new approach to data publication that will enable users to seamlessly contribute to updating the publicly available worldwide database of Swift observations. The effective goal is to have the table of Swift-DeepSky results always up-to-date with the latest observations taken by Swift. The container-based distributed analysis model means that the data processing and updating of the database will follow the actual user demand.
This service (i.e. the software link between the pipeline and a central VO-enabled service equipped with an automated data publishing pipeline) is currently under internal commissioning. In the months to come this integration should become public, but it will have no impact on the client side of Swift-DeepSky. The current automatic publication workflow being tested will provide two versions of results table: the best-of-all (boa) sources table, where each source appears only once and where the signal-to-noise ratio and the total exposure-time are maximum, and the best-on-times (bot) sources table, where sources may appear more than once for different epochs.
7. Conclusion
We have presented new sets of astronomical data products based on 14 years of Swift-XRT observations of blazars. The associated results database includes flux measurements, spectral and timing information, and other high-level material that can be accessed through the Virtual Observatory, the Open Universe portal, and in other ways. The pipeline software used to generate these data is also available in the form of an easy-to-use Docker container, which automatically downloads the low-level data and calibration necessary for the analysis, and can be run on all modern operating systems (Linux, Mac, Windows), thus removing platform dependencies and the need for any X-ray data analysis expertise.
Our approach significantly lowers technical barriers to X-ray data analysis, and introduces the possibility for anyone to reproduce the content of the database, extend it to other source types, or update it when new observations become available or when new versions of the software or calibration data are released. This is a major evolution compared to the traditional approach where astronomical catalogues are generated by teams of experts using complex hardware infrastructure and are issued at irregular time intervals, often of several years.
This paper advances, therefore, the first steps towards the implementation of a high-transparency, multi-frequency dynamic database service for the high-energy astrophysics community, which may become a particularly relevant resource in the emerging field of multi-messenger astronomy.
Following the principles of the Open Universe Initiative, this work is also meant to serve as a pathfinder to software solutions aiming to improve the usability of existing open space science data for a broader community of non-experts (scientists or otherwise) at a marginal cost. This is of particular importance in the context of the United Nations Sustainable Development Goals, as ease of access and transparency are key factors in the conversion of data into knowledge, and to achieve equal opportunities in the access of space science data and scientific information in general. Likewise, it is fully aligned with the mission of the UNOOSA in promoting international cooperation on the peaceful uses of outer space, and with the mandate of the Office following the UNISPACE conferences.
We encourage researchers, students, or anyone interested in X-ray astrophysics, to use this method and our software to build similar high-transparency scientific products for other types of astronomical sources.
Only one every ∼350 objects listed in current catalogues of AGN is a blazar. See Sect. 3.
Here we consider only single OBS_IDs with XRT exposures longer than 200 seconds in PC readout mode.
Acknowledgments
PG acknowledges the support of the Technische Universität München - Institute for Advanced Studies, funded by the German Excellence Initiative (and the European Union Seventh Framework Programme under grant agreement no. 291763). CHB acknowledges the support of ICRANet and the Brazilian government, funded by the CAPES Foundation, Ministry of Education of Brazil under the project BEX 15113-13-2. UBdA acknowledges the support of a CNPq Productivity Research Grant no. 310827/2016-7 and a Serrapilheira Institute Grant number Serra – 1812-26906. He also acknowledges the receipt of a FAPERJ Young Scientist Fellowship. AVP and OC are supported by the National Research Council of Argentina (CONICET) via grant PIP 616, and by the Agencia Nacional de Promoción Científica y Tecnológica (ANPCYT) PICT 140492. AVP and OC are members of the Scientific Research career of the CONICET. This work is part of the PUE -IFLP (CONICET).
References
- Acero, F., Ackermann, M., Ajello, M., et al. 2015, ApJS, 218, 23 [Google Scholar]
- Ackermann, M., Ajello, M., Atwood, W. B., et al. 2015, ApJ, 810, 14 [NASA ADS] [CrossRef] [Google Scholar]
- Arnaud, K. A. 1996, in Astronomical Data Analysis Software and Systems V, eds. G. H. Jacoby, & J. Barnes, ASP Conf. Ser., 101, 17 [NASA ADS] [Google Scholar]
- Atoyan, A. M., & Dermer, C. D. 2003, ApJ, 586, 79 [NASA ADS] [CrossRef] [Google Scholar]
- Barthelmy, S. D., Barbier, L. M., Cummings, J. R., et al. 2005, Space Sci. Rev., 120, 143 [NASA ADS] [CrossRef] [Google Scholar]
- Burrows, D. N., Hill, J. E., Nousek, J. A., et al. 2005, Space Sci. Rev., 120, 165 [NASA ADS] [CrossRef] [Google Scholar]
- Chang, Y. L., Arsioli, B., Giommi, P., Padovani, P., & Brandt, C. H. 2019, A&A, accepted [arXiv:1909.08279] [Google Scholar]
- Comastri, A., Setti, G., Zamorani, G., & Hasinger, G. 1995, A&A, 296, 1 [NASA ADS] [Google Scholar]
- Cruz-Gonzalez, I., & Huchra, J. P. 1984, AJ, 89, 441 [NASA ADS] [CrossRef] [Google Scholar]
- D’Elia, V., Perri, M., Puccetti, S., et al. 2013, A&A, 551, A142 [NASA ADS] [CrossRef] [EDP Sciences] [Google Scholar]
- Demleitner, M., Neves, M. C., Rothmaier, F., & Wambsganss, J. 2014, Astron. Comput., 7, 27 [NASA ADS] [CrossRef] [Google Scholar]
- Evans, P. A., Osborne, J. P., Beardmore, A. P., et al. 2014, ApJS, 210, 8 [NASA ADS] [CrossRef] [Google Scholar]
- Flesch, E. W. 2015, PASA, 32, 10 [Google Scholar]
- Fossati, G., Maraschi, L., Celotti, A., Comastri, A., & Ghisellini, G. 1998, MNRAS, 299, 433 [NASA ADS] [CrossRef] [Google Scholar]
- Gehrels, N., Chincarini, G., Giommi, P., et al. 2004, ApJ, 611, 1005 [NASA ADS] [CrossRef] [Google Scholar]
- Ghisellini, G., Celotti, A., Fossati, G., Maraschi, L., & Comastri, A. 1998, MNRAS, 301, 451 [NASA ADS] [CrossRef] [Google Scholar]
- Giommi, P. 2015, J. High Energy Astrophys., 7, 173 [NASA ADS] [CrossRef] [Google Scholar]
- Giommi, P., & Colafrancesco, S. 2004, A&A, 414, 7 [NASA ADS] [CrossRef] [EDP Sciences] [Google Scholar]
- Giommi, P., Ansari, S. G., & Micol, A. 1995, A&AS, 109, 267 [NASA ADS] [Google Scholar]
- Giommi, P., Padovani, P., Polenta, G., et al. 2012a, MNRAS, 420, 2899 [NASA ADS] [CrossRef] [Google Scholar]
- Giommi, P., Polenta, G., Lähteenmäki, A., et al. 2012b, A&A, 541, A160 [NASA ADS] [CrossRef] [EDP Sciences] [Google Scholar]
- Giommi, P., Arrigo, G., Barres De Almeida, U., et al. 2018, ArXiv e-prints [arXiv:1805.08505] [Google Scholar]
- Harrison, F. A., Craig, W. W., Christensen, F. E., et al. 2013, ApJ, 770, 103 [NASA ADS] [CrossRef] [Google Scholar]
- IceCube Collaboration, Aartsen, M. G., Ackermann, M., et al. 2018, Science, 361, 147 [NASA ADS] [Google Scholar]
- Keivani, A., Murase, K., Petropoulou, M., et al. 2018, ApJ, 864, 84 [NASA ADS] [CrossRef] [Google Scholar]
- Mannheim, K. 1995, Astropart. Phys., 3, 295 [NASA ADS] [CrossRef] [Google Scholar]
- Massaro, E., Maselli, A., Leto, C., et al. 2015, Ap&SS, 357, 75 [NASA ADS] [CrossRef] [Google Scholar]
- Mateos, S., Warwick, R. S., Carrera, F. J., et al. 2008, A&A, 492, 51 [NASA ADS] [CrossRef] [EDP Sciences] [Google Scholar]
- Padovani, P., Alexander, D. M., Assef, R. J., et al. 2017, A&A Rev., 25, 2 [NASA ADS] [CrossRef] [Google Scholar]
- Padovani, P., Giommi, P., Resconi, E., et al. 2018, MNRAS, 480, 192 [NASA ADS] [CrossRef] [Google Scholar]
- Pollock, A. M. T. 2018, Space Res. Today, 201, 15 [Google Scholar]
- Puccetti, S., Capalbi, M., Giommi, P., et al. 2011, A&A, 528, A122 [NASA ADS] [CrossRef] [EDP Sciences] [Google Scholar]
- Resconi, E., Coenders, S., Padovani, P., Giommi, P., & Caccianiga, L. 2017, MNRAS, 468, 597 [NASA ADS] [CrossRef] [Google Scholar]
- Rodrigues, X., Fedynitch, A., Gao, S., Boncioli, D., & Winter, W. 2018, ApJ, 854, 54 [NASA ADS] [CrossRef] [Google Scholar]
- Romero, G. E., Boettcher, M., Markoff, S., & Tavecchio, F. 2017, Space Sci. Rev., 207, 5 [NASA ADS] [CrossRef] [Google Scholar]
- Roming, P. W. A., Kennedy, T. E., Mason, K. O., et al. 2005, Space Sci. Rev., 120, 95 [NASA ADS] [CrossRef] [Google Scholar]
- Tavecchio, F., Ghisellini, G., & Guetta, D. 2014, ApJ, 793, L18 [NASA ADS] [CrossRef] [Google Scholar]
- Urry, C. M., & Padovani, P. 1995, PASP, 107, 803 [NASA ADS] [CrossRef] [Google Scholar]
- Wilkinson, M. D., Dumontier, M., & Aalbersberg, I. J. 2016, Sci. Data, 3 [Google Scholar]
Appendix A: The Swift-DeepSky pipeline
Swift-DeepSky is a software pipeline assembled using the Swift X-Ray Telescope Data Analysis Software (XRTDAS), designed and developed under the responsibility of the Space Science Data Center (SSDC) of the Italian Space Agency (ASI) and distributed within the NASA HEASoft26 data reduction package and related Swift-XRT calibration files (CALDB)27, which performs a complete X-ray image analysis of Swift-XRT data. A detailed description of the pipeline is given in Brandt et al. (in prep.); in this appendix we outline the main features.
Swift-DeepSky executes in sequence the following main tasks:
1. The list of all OBS_IDs performed by Swift in the chosen period is retrieved and those executed in PC mode with exposure times longer than 200 s are selected;
2. The data and calibration files that are necessary for the analysis from one of the Swift official archives are downloaded;
3. Exposure maps are built for every OBS_ID;
4. If more than a single OBS_ID has been performed in the chosen period (one week in this paper) exposure maps and event files are added;
5. The event list and exposure map are read by the XIMAGE tool, and X-ray images are built in the full 0.3–10.0 keV band;
6. The X-ray image is searched by the XIMAGE/DETECT command for pointlike sources;
7. The background is estimated by XIMAGE in four energy intervals: the full band (0.3–10.0 keV), the soft (0.3–1.0 keV), medium (1.0–2.0 keV), and hard band (2.0–10.0 keV);
8. For every detected source in the full band, the count rates in all bands are estimated by the XIMAGE/SOSTA tool for all sources found by DETECT, and three-sigma upper limits are calculated when a source is below the detection threshold;
9. The NH command is run to estimate the Galactic hydrogen column in the direction of the source;
10. An estimate of a power-law spectral slope is obtained by inverting the count-rate ratio in the soft+medium and in the hard band;
11. Fluxes in all energy bands are calculated on the basis of count rates and NH assuming a power-law spectrum with slope estimated from the hardness ratio or assuming an energy index of 0.8 for sources with less than ∼50 net counts;
12. Galactic absorption-corrected νf(ν) fluxes, suitable for SED plotting are calculated from the counts estimated in the soft, medium, and hard band, and from the full band;
13. A second value of the power-law spectral slope is estimated by means of a linear least square fit to the 0.5, 1.5, and 4.5 keV νf(ν) fluxes;
14. If requested all the products are uploaded to a central database and made publicly available.
The software is publicly available either as open-source code or encapsulated in a Docker container ready to be used in multiple platforms: MacOS, Linux, and Windows10 Pro.
The source code and documentation to install and run the pipeline are available on Github28. The Docker images are available from the Docker cloud29.
As part of the processing, the exposure-maps of each observation are processed in real time which demands the use of Swift (XRT) CALDB. CALDB is a rather large data package, and also evolves almost independently from the HEASoft tools. In the Swift-DeepSky this modularity is respected, and what we do is to provide two containers that work together: one for the pipeline and one for CALDB.
Once Docker is installed30, all that is needed to have the whole pipeline working is to pull the chbrandt/swift_deepsky and the chbrandt/heasoft_caldb containers:
$ docker pull chbrandt/swift_deepsky
$ docker pull chbrandt/heasoft_caldb
The pipeline is then run as a combination of two containers. To do this, first instantiate the CALDB container,
$ docker run -dt --name caldb chbrandt/heasoft_caldb
then run the pipeline:
$ docker run -it --rm --volumes-from caldb \
          chbrandt/swift_deepsky
Since in this case no sky position was specified, the pipeline will simply output the command-line help message.
When a complete input is provided the results of the pipeline are written internally (to the container) to a directory called /work; this directory must be made available to any path in the host system. The examples below will use the users’ home tmp/sds path to share the data.
For example, to run the pipeline around the position (RA = 317.58788, Dec = −86.2894):
$ docker run -it --rm --volumes-from caldb \
          -v $HOME/tmp/sds:/work \
          chbrandt/swift_deepsky \
               --ra 317.58788 --dec -86.2894
Another possibility is to give the name of a known astronomical object. In this case the pipeline will consult Simbad31 to obtain the corresponding coordinates. Time windowing is also a possibility with Swift-DeepSky:
$ docker run -it --rm --volumes-from caldb \
          -v $HOME/tmp/sds:/work \
          chbrandt/swift_deepsky \
               --object 3c279 \
               --start 2018-06-01 \
               --end 2018-12-31
It will use all Swift-XRT observations including the well-known blazar 3c279 taken between June 1, 2018 and December 31, 2018.
Links to the pipeline software and documentation are available from the Open Universe portal32 under the “Open Software” menu.
The Docker version of the Swift-DeepSky pipeline can be considered a high-transparency X-ray data analysis software tool because (a) it can be downloaded and installed with a few clicks; (b) it removes platform dependencies and the need to download the data and calibration files from the archive; and (c) it lowers the barrier to X-ray data analysis, which enables users, with or without experience in Swift-XRT data analysis, to run data reduction software that generates reliable science-ready standard data products usable by everyone.
All Tables
Blazars observed by Swift with short and frequent, mostly daily XRT exposures in PC mode.
All Figures
|
Fig. 1. Distribution of XRT exposure time in PC mode dedicated to known blazars over the 14 years of Swift mission operations covered in this work. |
| In the text | |
|
Fig. 2. Distribution of Swift exposure times of single OBS_ID pointings where the XRT field of view includes a known blazar. There is a strong peak at 1 ks. |
| In the text | |
|
Fig. 3. Count rate in the 0.3–10.0 keV band vs the vignetting-corrected exposure time for all the sources detected in the data set considered. FSRQs: blue points; BL Lacs: green points; other targets and serendipitous sources: light grey points. The dotted horizontal line marks the count-rate limit above which pileup problems become significant in data taken in PC mode. The red histogram represents the number of blazars in each time bin, showing three peaks at approximately 1, 2, and 4–5 ks, the preferred exposure times for blazars. |
| In the text | |
|
Fig. 4. 0.3–10.0 keV band flux vs vignetting-corrected exposure time for all detected sources free of pileup in PC mode (count rate< 0.6 cts s−1). Colour–coding as in Fig. 3. |
| In the text | |
|
Fig. 5. Spectral energy distribution of BL Lacertae. The grey points are archival multi-frequency data. The red points are from this work. |
| In the text | |
|
Fig. 6. History of the 0.3–10.0 keV band flux and estimated power-law energy spectral slope of BL Lacertae. |
| In the text | |
|
Fig. 7. Spectral energy distribution of the blazar OJ 287. The grey points are archival multi-frequency data. The red points are from this work (data in PC mode and count rate < 0.6 cts s−1). The green points are XSPEC spectra from the first analysis of all the XRT data in PC and WT mode run on a small subsample of blazars (Giommi 2015). |
| In the text | |
|
Fig. 8. νf(ν) flux at 0.5, 4.5 keV and the power-law energy spectral index of the blazar OJ 287 are plotted against observation date. Many differences in the top and middle panels are clearly visible; in particular, the X-ray flares occur in different periods in the soft (0.5 keV) and hard (4.5 keV) parts of the X-ray spectrum. |
| In the text | |
|
Fig. 9. 0.3–10.0 keV and 2–10 keV band flux in units of 10−12 erg cm−2 s−1 (top and middle panel), and the power-law photon index of TXS0506+056 (bottom panel) are plotted as a function of time. All uncertainties are given at 1σ. |
| In the text | |
|
Fig. 10. Distribution of the power-law energy spectral index in the subsamples of FSRQs (top), BL Lacs (middle), and radio quiet QSOs (bottom). |
| In the text | |
|
Fig. 11. Redshift distribution of FSRQs with different power-law spectral indices (α). The black dotted histogram refers to objects with α > 0.5, while the red solid histogram is for sources with α < 0.5. FSRQs with flat spectral slopes tend to have higher redshifts. |
| In the text | |
Current usage metrics show cumulative count of Article Views (full-text article views including HTML views, PDF and ePub downloads, according to the available data) and Abstracts Views on Vision4Press platform.
Data correspond to usage on the plateform after 2015. The current usage metrics is available 48-96 hours after online publication and is updated daily on week days.
Initial download of the metrics may take a while.