Free Access
Fig. 11.
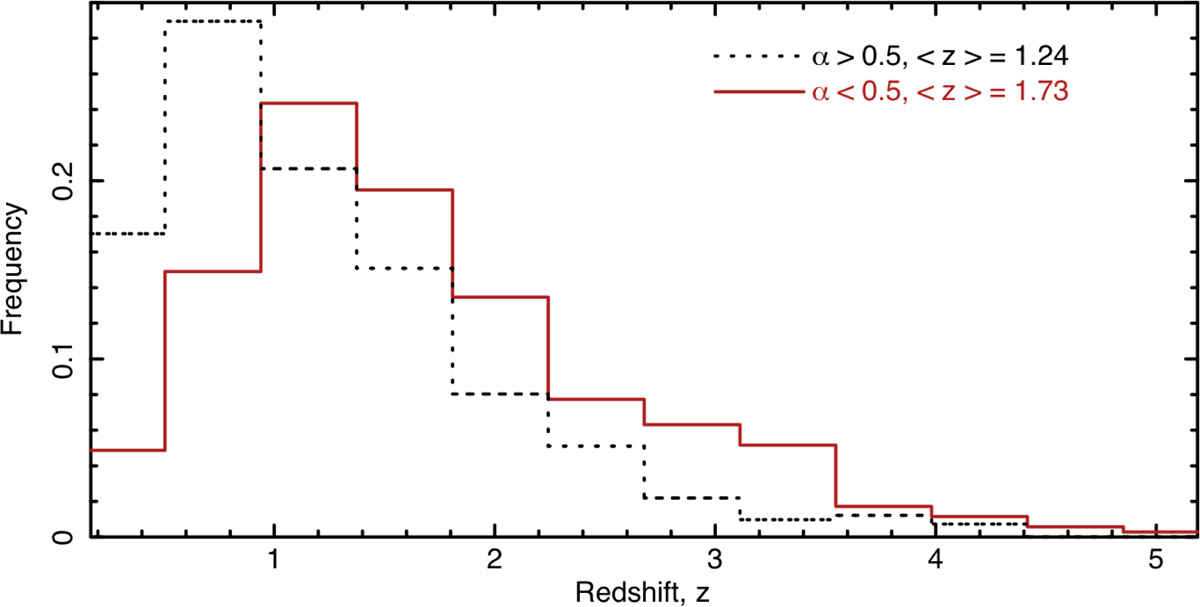
Redshift distribution of FSRQs with different power-law spectral indices (α). The black dotted histogram refers to objects with α > 0.5, while the red solid histogram is for sources with α < 0.5. FSRQs with flat spectral slopes tend to have higher redshifts.
Current usage metrics show cumulative count of Article Views (full-text article views including HTML views, PDF and ePub downloads, according to the available data) and Abstracts Views on Vision4Press platform.
Data correspond to usage on the plateform after 2015. The current usage metrics is available 48-96 hours after online publication and is updated daily on week days.
Initial download of the metrics may take a while.