| Issue |
A&A
Volume 631, November 2019
|
|
|---|---|---|
| Article Number | A179 | |
| Number of page(s) | 5 | |
| Section | Interstellar and circumstellar matter | |
| DOI | https://doi.org/10.1051/0004-6361/201935487 | |
| Published online | 21 November 2019 | |
XMM-Newton and Fermi/LAT view on the supernova remnant 3C434.1
1
Institut für Astronomie und Astrophysik,
Sand 1,
72076 Tübingen,
Germany
e-mail: This email address is being protected from spambots. You need JavaScript enabled to view it.
2
Space Research Institute of the Russian Academy of Sciences,
Profsoyuznaya Str. 84/32,
Moscow 117997,
Russia
3
Dr. Remeis-Sternwarte and ECAP, Universität Erlangen-Nürnberg,
Sternwartstr. 7,
96049 Bamberg,
Germany
4
Friedrich-Alexander-Universität Erlangen-Nürnberg, Erlangen Centre for Astroparticle Physics,
Erwin-Rommel-Str. 1,
91058 Erlangen,
Germany
Received:
18
March
2019
Accepted:
23
August
2019
Abstract
We report on XMM-Newton observations of the supernova remnant (SNR) 3C434.1 (G94.0+1.0), the first in X-rays since the ROSAT era. Our analysis confirms the thermal origin of the observed extended X-ray emission, whose morphology appears more complex than previously reported. In particular, part of the shell shows a significantly harder spectrum which is consistent with a power law, and it is, therefore, likely of non-thermal origin. Motivated by these finding, we revisited the GeV observations of the field taken with the Fermi observatory. A significant excess associated with the remnant was detected, which is likely associated with non-thermal X-ray emission from part of the shell. The analysis of the Fermi data resulted in the serendipity discovery of GeV emission from the nearby SNR G093.7-00.2. Finally, we searched for a possible compact remnants within the shell, however, no obvious candidates could be identified due to the fairly large positional uncertainties.
Key words: ISM: supernova remnants / stars: neutron / gamma rays: general
© ESO 2019
1 Introduction
The supernova remnant (SNR) 3C434.1 (G94.0+1.0) is a shell-type SNR with a radius of ~13′ in the radio band (Willis 1973; Goss et al. 1984). The first study of the SNR properties was carried out by Foster (2005) based on the Canadian Galactic Plane radio Survey and ROSAT X-ray data.
The morphology of the extended emission is rather complex with a well-defined circular eastern shell, distorted toward the west. There, the SNR extends in a tail-like structure piercing a “torus”, which appears to coincide with a nearby CO cloud, suggesting that the SNR interacts with the interstellar medium (Jeong et al. 2013). The radio continuum slope is α ~ 0.38, fairly constant throughout the shell, and shows no breaks, suggesting that particle acceleration is similar (Foster 2005) at least up to GeV energies.
The kinematic distance to the SNR is estimated at 3–4.5 kpc (Foster 2005; Jeong et al. 2013), that is, probably within the Perseus spiral arm, which implies a linear shell radius of ~10−30 pc. The source has an estimated age of 8–25 ky, that is, the remnant is fairly young, and is likely still expanding within the stellar wind bubble of the massive (≥8 M⊙) progenitor (Foster 2005; Jeong et al. 2013). The SNR thus presumably stems from a core-collapse supernova and hosts a compact object remnant. The source is also detected in Hα in the optical band and in X-rays, which allowed for the study of most of the relevant parameters of the remnant (Foster 2005). Detection of the associated CO emission led to a revision of some of the parameters (Jeong et al. 2013).
The X-ray emission observed with ROSAT appears to be purely thermal (~4.5 × 10⁶ K), and fills most of the shell volume (Foster 2005). We note, however, that a detailed morphological and spectral analysis in the X-ray band was precluded by the low statistics and ROSAT’s limited energy range. A possible isolated neutron star was also identified by Belloni et al. (1997) in the same field based on ROSAT colors and lack of optical counterparts (the last source in the Table 5 of their paper).
In this article we report on recent observations of the SNR taken with XMM-Newton and on Fermi/LAT observations of the field in the GeV band. We examine properties of extended emission in the X-ray band and search for possible compact remnants within the shell. We also revisit archival Fermi/LAT observations and discuss the possible association between the observed X-ray and GeV emission.
2 Observations and data analysis
2.1 Extended X-ray emission
The SNR was observed with XMM-Newton in 2008 and 2016 for 15 ks (obsid. 0553110301) and 30 ks (obsid. 0781460101). The first observation, however, is strongly contaminated by soft-proton flaring background and cannot be used for scientific analysis. We focus on the second observation which was originally aimed at searching for a possible central compact object (CCO) within the shell. This is the first deep observation of the source since ROSAT observed it for ~ 9 ks in 1992 (Foster 2005).
The entire radio shell falls within the XMM-Newton field of view (FOV), so the background can be estimated using source-free regions. We found, however, that the low surface brightness of the extended emission and a fairly high level of in-orbit background in the observation due to residual soft-proton contamination made direct background subtraction unfeasible. The main issue is that the cosmic, quiescent particle (QPB) and residual softproton (SP) background components are known to vary differently across the field of view (Pradas & Kerp 2005). Background spectra extracted at the edge of the FOV (that is, outside of the SNR shell as observed in radio band) are not representative of that in the center. This necessitates independent modeling of the cosmic (uniform across the field), and instrumental background (calibrated through filter-wheel closed observations) as described below.
We note that the data taken at the beginning of the second observation are also contaminated by proton flares, which reduces the total effective exposure reduced to ~26−28 and ~14 ks for the MOS and PN XMM-Newton cameras after standard filtering by using mos-filter and pn-filter. Some residual contamination remains even after filtering. We estimate the residual instrumental background contribution to be up to ~ 50% of the net count rate, so any uncertainty in the background spectrum has a significant effect on the resulting spectrum of the source.
Therefore, to estimate the background contribution we used the same approach as in Doroshenko et al. (2017). In particular, the Extended Source Analysis Software package of XMM-SAS (Snowden & Kuntz 2014) was used to screen the data (mos-filter and pn-filter tasks) and to extract the source and scaled QPB spectra for the source and background regions defined in Fig. 1 (mos-spectra, pn-spectra, mos_back and pn_back tasks). The point sources serendipitously detected in the field were masked at this stage, so we only focus on an analysis of the extended emission.
The estimated QPB spectra can then be subtracted both for the source and the background regions, and the resulting spectra can be modeled simultaneously to estimate the spectrum and flux of the source and the cosmic background and residual SP contamination. Known instrumental lines which are not included in the QPB spectra produced by ESAS (see XMM-SOC-CAL-TN-00181 and Sect. 6.5, 8.1, and 8.4 of ESAS cookbook2 for detail) were also included in the fit. The background components for both source and background regions can be linked with appropriate scaling coefficients evaluated with the proton_scale task (see A25 in the ESAS cookbook for details). In this way we effectively use photons from the entire field of view to model the residual soft proton and cosmic background components, and add source component for thermal emission from within the shell.
For fitting, we grouped all spectra to contain at least 100 counts per energy bin and modeled the resulting six spectra (3 cameras for two regions) simultaneously using standard χ2 statistics with weighting from Gehrels (1986).
The residual soft-proton spectrum was described with a broken power-law not folded through the instrument’s response. The break energy was fixed at 3.2 keV and the high energy index at 2.5 for all instruments. It is important to emphasize that the cosmic background is assumed to be uniform throughout the field of view, and is scaled to the effective area for each given region (i.e. correcting for the gaps between detector chips, bad pixels and masked point sources). On the other hand, the scaling for SP normalization is obtained based on the filter wheel closed data (see ESAS manual for details).
To model the cosmic background we considered the following components: unabsorbed Local Bubble emission (modelled as collisional-ionized diffuse gas with solar abundances and fixed kT = 0.1 keV), absorbed Galactic disk and halo (modelled with collisionally-ionized diffuse gas emission with solar abundances and fixed kT = 0.7 keV), and background AGN emission (power-law with fixed Γ = 1.46 and scaled normalisation of 4.6 × 10⁻⁷ photons keV−1 cm−2 s−1 arcmin−2 at 1 keV Cappelluti et al. 2009). To model the SNR emission from the source region, we used the same single temperature (in equilibrium) plasma model of Raymond & Smith (1977) as in Foster (2005). The absorption was modelled using the tbabs model with Wilms et al. (2000) abundances and a single absorption column for all absorbed components (including the relevant background components). We emphasize that we fit jointly source and background regions, and as such, also background counts from the source region are used to constrain the background. The best-fit parameters for the joint fit of all spectra with various model component linked as described above are summarized in Table 1 and are consistent with those reported by Foster (2005). The resulting quality of the joint fit of source and background models is adequate with reduced χ2 ~ 0.9 with no apparent irregularities in residuals of either spectra although the low counting statistics does not permit to inspect residuals with sufficient resolution. For illustration, in Fig. 2 we also show the unfolded EPIC PN background-subtracted spectrum and the corresponding best-fit model. We note that the purpose of the figure is only to illustrate the overall spectral shape and the available statistics, as the actual fitting was done as described above.
The final map of the region, based on the modeling described above and corrected for QPB and SP contamination, is presented in Fig. 1. We note that the blue region in the upper part of the image at the edge of the FOV is likely also a point source associated with extra-galactic radio source, which escaped formal detection in X-ray band. The thermal SNR emission is mostly confined to soft band, whereas some hard emission from the filament in the southern part of the remnant (marked with a yellow circle) can also be identified in the hard band. The data confirm the absence of limb-brightening of the thermal X-ray emission and thus the lack of direct correspondence between the radio continuum outer shell and the thermal emission. There is however a good agreement between the radio surface brightness in the (projected) interior of the remnant (toward the east) and the thermal XMM-Newton emission there, which confirms with higher statistics the trend already indicated by the ROSAT data (Foster 2005), and used as an argument in favor of the interaction of the SNR shock with an in-homogeneous circumstellar matter.
The total number of counts detected from the SNR is ~ 14 000 or ~ 25% of the total count-rate of the source region. This emphasizes the importance of accurate background modeling, particularly in the hard X-ray band where no significant emission from the shell is detected. A comparatively high background rate and the uncertainty in the instrumental background thus precluded us from significantly detecting any additional components contributingto the hard part of the spectrum such as possible synchrotron emission when the entire source region is considered.
We note, however, that a hint of such a component is given by the hard-band (2.4–7 keV) map, which reveals a single filament in the southern part of the shell. The spectrum extracted from this region appears harder with Γ ~ 2.1(0.5) (all uncertainties are 1σ confidence unless stated otherwise) and an unabsorbed flux of ~ 10−12 erg cm−2 s−1 when modelled with a power law, i.e., clearly inconsistent with the rest of the shell. The best-fit filament’s spectral parameters depend, however, strongly on the assumed contribution of thermal emission background which constitutes ~ 80% of source counts in this region. Significantly deeper observations are thus required to draw definite conclusions on the flux and spectral shape from the region. As already mentioned above, an inclusion of the same power-law component as part of the source model for the entire shell only allows us to put an upper limit on its flux, so most of the hard emission, if present at all, is confined to the single filament. Still, the hardening of the spectrum in the southern part appears plausible, and is most readily interpreted as enhanced non-thermal emission, possibly due to the interaction of the shock with denser surrounding medium.
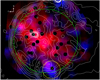 |
Fig. 1 Background-subtracted (quiescent particle background and soft-proton background only), exposure-corrected and adaptively smoothed pseudo-color map covering region of SNR 3C434.1 as observed with XMM-Newton PN and MOS cameras (linear scaling) in soft (0.5–2.4 keV, red) and hard (2.4–7 keV, blue) bands. Contours corresponding to radio emission as observed in the CGPS 1420 Mhz map (white), and regions used for X-ray spectral analysis (solid green circle with radius of 10′ for the thermal emission, the region outside the dashed circle for the corresponding background, and yellow circle for the non-thermal emission (radius of 2.5′) are also shown. |
Best fit parameters of the SNR emission modeled as optically thin single temperature plasma (Raymond & Smith 1977).
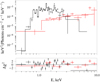 |
Fig. 2 Background-subtracted EPIC PN spectra of entire shell (black) and of hard filament in southern part of the shell (red). The background for both spectra was estimated from best-fit model for presentation purposes only, and actual modeling was done by simultaneously fitting source and off-source regions as described in the text. |
2.2 Search for possible compact remnant
A search for a possible central compact object within the shell was the original goal of our XMM-Newton observation, so we investigated possible candidates among the 34 serendipitous detected point sources in the field. To improve the astrometric accuracy, the field wasrectified using the catcorr task following the same procedures as described for the XMM-Newton serendipitous source catalog (Rosen et al. 2016). The corrected X-ray positions were then cross-matched with the 2MASS (Skrutskie et al. 2006), USNO-1B (Monet et al. 2003), and Gaia DR2 (Gaia Collaboration 2018) catalogs. Comparison of X-ray and optical positions of uniquely matched sources allowed then to estimate remaining systematic positional uncertainty was then estimated at 0.5′′ which we add in quadrature to statistical positional uncertainty. The counterpart search was then repeated within 3σ confidence region defined by this updated uncertainty. Several faint objects with no obvious optical cataloged counterpart also have been identified as a result. Subsequent visual inspection of the 2MASS and Spitzer GLIMPSE (Benjamin et al. 2003; Churchwell et al. 2009) 3–8 μm mid-infrared maps revealed, however, likely counterparts for all but three sources. These are listed in the XMM-Newton serendipitous source catalogue (Rosen et al. 2016) under source identification numbers 207814601010034, 207814601010036, and 207814601010067. Considering the improved position for the isolated neutron star candidate suggested by Belloni et al. (1997) we note that there appears to be a faint infrared counterpart for this source, and thus it is likely a background AGN.
The remaining three objects with no counterparts are very faint, and also have potential counterparts right outside of their XMM error circles. Available low counting statistics precludes detailed spectral and timing analysis of these objects, and even confirmation of absence of counterparts in other bands requires a follow-up with Chandra. We conclude thus that there appears to be no obvious candidate compact remnant within the shell.
2.3 Fermi/LAT observations of the field
Motivated by the detection of possible synchrotron emission from the shell, we revisited the observations of the field with Fermi/LAT. The selected GeV data cover more than ten years (Aug. 2008 to Dec. 2018). We performed the analysis with the latest available fermitools with P8_R3 response functions (CLEAN photon class)3.
The region of interest (ROI) for the analysis is an 18°-radius circle around the position of the SNR 3C434.1. The model of the ROI includes all sources from the 8-yr Fermi/LAT source list (FL8Y4) as well as standard templates for the Galactic and extra-galactic diffuse backgrounds (given by iso_P8R3_CLEAN_V2.txt and the gll_iem_v06.fits templates). It is important to note that when this work was at the final stage of preparation, 4FGL catalogue (Fermi-LAT Collaboration 2019) was released by the Fermi/LAT collaboration with 4FGL J2123.9+5158 source identified asSNR 3C434.1. We checked, that the spectral parameters (normalization and the slope) of this source are consistent with those reported here for the SNR 3C434.1. The spectra of all sources present in the model were assumed to be described by the FL8Y catalogue, with all parameters except the normalization fixed to their catalogue values. In order to avoid possible systematic effects, we have also included the FL8Y sources located up to 10° beyond the ROI into the model, with all parameters fixed to their catalogue values.
We started with building the test-statistics (TS; Mattox et al. 1996) map of the 7° × 7° region surrounding the SNR 3C434.1 at 1−10 GeV energies (Fig. 3). This map illustrates the significance ( ) of a point-like test source placed at each map pixel. All known sources, which are already included in the FL8Y model, are not visible in Fig. 3. The TS map reveals several significant residuals in the vicinity of SNR 3C434.1, which indicates the presence of previously unknown sources in the region. These sources are marked in Fig. 3 with magenta circles. The most significant newly detected source spatially coincides with the position of SNR 3C434.1, see Table 2 for a summary of all non-FL8Y-catalogue sources.
Lacking counterparts at other wavelengths, the new sources are most likely associated with molecular clouds not yet included into the Galactic diffuse background model, since they are located close to the Galactic plane. In addition, the marginal detection of GeV emission from another SNR in the field, G093.7-002, is also of interest since only upper limits on the GeV flux of this source have been reported in literature so far (Acero et al. 2016).
In the next step of the analysis, we included the newly detected sources into the model of the region assuming their spectra to be described by simple power-laws with free normalization and slope. With the updated ROI model we then performed astandard binned analysis of Fermi/LAT data fitting the spatial and spectral model of the sky region around the source of interest to the data. Following the recommendation of the Fermi/LAT collaboration, we performed our analysis enabling energy dispersion handling. Where applicable, upper limits were extracted for TS < 4 cases with the UpperLimits python module provided with the Fermi/LAT software and correspond to a 95 per cent (≃ 2σ) confidence level.
The analysis in the broad energy range (0.1–300 GeV) allowed us to find the best-fit slope of SNR 3C434.1 (2.3 ± 0.2) as well as the slopes of all non-catalogued sources present in the model (Table 2). A log-parabola spectral model for the SNR 3C434.1 is only marginally (at the ~2σ level) preferable over a power-law. Thus, for the analysis in a set of narrower energy ranges we fixed the slopes of the SNR 3C434.1 and the non-catalogued sources to their best-fit power-law values over the 0.1–300 GeV range. As illustrated in Fig. 4, the fluxes in two bands appear to agree with each other, which could suggest that the observed GeV emission is indeed associated with the shell. We note, however, that spatial resolutions of X-ray and GeV maps are drastically different, so direct flux comparison is not fully correct, particularly if GeV emission comes from a larger area.
Properties of the non-FL8Y-catalogue sources used in the Fermi/LAT data analysis.
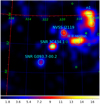 |
Fig. 3 Test statistics (TS) map of the 7° × 7° region around SNR 3C434.1 in the 1–10 GeV band as observed with Fermi/LAT. FL8Y catalogue sources (green symbols) were included into the model of the region and thus are not visible in the map. The positions of non-catalogue sources detected within the analysis are shown with cyan circles. |
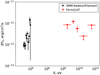 |
Fig. 4 Fermi/LAT spectrum (red points) of the source spatially coinciding with SNR 3C434.1. XMM-Newton spectra of the hard filament in the southern part of the shell are shown with black and blue points. |
3 Conclusions
Consistent with previous reports based on ROSAT data, the analysis of our recent XMM-Newton observation of the SNR 3C434.1 reveals the presence of optically thin thermal emission filling the eastern part of the radio shell. The X-ray spectrum and flux were also found to be consistent with earlier reports. The XMM-Newton data confirm with higher statistics that the thermal emission does not reveal any limb-brightening and is not correlated with the outer shell seen in the radio continuum. There is however agood morphological correspondence of the X-ray and radio emission in the eastern interior of the shell. The multi-band imaging also showed a single hard filament with a non-thermal power law spectrum. Such a spectrum is most readily interpreted as synchrotron emission from electrons accelerated at the shock. The complex morphology and spectral variations of the observed X-ray emission also indicate the interaction with the ISM as already suggested by the radio data. The limited counting statistics and the complicated instrumental background make it hard, however, to robustly estimate the spectral parameters from this region, so follow-up observations are encouraged.
Besides the complex morphology of the extended emission and a likely detection of a localized non-thermal component, we also investigated the possible presence of a compact object within the SNR. Unfortunately, no obvious candidate was identified, although there are several faint sources with no counterparts in other bands could be detected. A follow-up observationswith Chandra is required to improve positional accuracy and confirm absence of counterparts in other bands.
Motivated by the discovery of non-thermal emission we revisited the Fermi/LAT observations of the region. Indeed, we were able to detect GeV emission associated with the SNR 3C434.1, at a ~ 4σ confidence level likely associated with the hard filament in the southern part of the shell. Last but not least, the analysis of the Fermi data allowed us to detect at ~3σ level the GeV emission from another nearby SNR, G093.7-00.2, for which only upper limits at GeV energies were available in literature, including the most recent 4FGL catalogue of Fermi/LAT sources (Fermi-LAT Collaboration 2019).
Acknowledgements
This work was supported by the Carl-Zeiss Stiftung through the grant “Hochsensitive Nachweistechnik zur Erforschung des unsichtbaren Universums” to the Kepler Center für Astro- und Teilchenphysik at the University of Tübingen and by the Russian Science Foundation through grant 19-12-00423. The authors acknowledge support by the state of Baden-Württemberg through bwHPC, and by the Eberhard Karl University of Tübingen.
References
- Acero, F., Ackermann, M., Ajello, M., et al. 2016, ApJS, 224, 8 [NASA ADS] [CrossRef] [Google Scholar]
- Belloni, T., Zampieri, L., & Campana, S. 1997, A&A, 319, 525 [NASA ADS] [Google Scholar]
- Benjamin, R. A., Churchwell, E., Babler, B. L., et al. 2003, PASP, 115, 953 [NASA ADS] [CrossRef] [Google Scholar]
- Cappelluti, N., Brusa, M., Hasinger, G., et al. 2009, A&A, 497, 635 [NASA ADS] [CrossRef] [EDP Sciences] [Google Scholar]
- Churchwell, E., Babler, B. L., Meade, M. R., et al. 2009, PASP, 121, 213 [NASA ADS] [CrossRef] [Google Scholar]
- Doroshenko, V., Pühlhofer, G., Bamba, A., et al. 2017, A&A, 608, A23 [NASA ADS] [CrossRef] [EDP Sciences] [Google Scholar]
- Fermi-LAT Collaboration 2019, ArXiv e-prints [arXiv:1902.10045] [Google Scholar]
- Foster, T. 2005, A&A, 441, 1043 [NASA ADS] [CrossRef] [EDP Sciences] [Google Scholar]
- Gaia Collaboration (Brown, A. G. A., et al.) 2018, A&A, 616, A1 [NASA ADS] [CrossRef] [EDP Sciences] [Google Scholar]
- Gehrels, N. 1986, ApJ, 303, 336 [NASA ADS] [CrossRef] [Google Scholar]
- Goss, W. M., Mantovani, F., Salter, C. J., Tomasi, P., & Velusamy, T. 1984, A&A, 138, 469 [NASA ADS] [Google Scholar]
- Jeong, I.-G., Koo, B.-C., Cho, W.-K., et al. 2013, ApJ, 770, 105 [NASA ADS] [CrossRef] [Google Scholar]
- Mattox, J. R., Bertsch, D. L., Chiang, J., et al. 1996, ApJ, 461, 396 [NASA ADS] [CrossRef] [Google Scholar]
- Monet, D. G., Levine, S. E., Canzian, B., et al. 2003, AJ, 125, 984 [NASA ADS] [CrossRef] [Google Scholar]
- Pradas, J., & Kerp, J. 2005, A&A, 443, 721 [NASA ADS] [CrossRef] [EDP Sciences] [Google Scholar]
- Raymond, J. C., & Smith, B. W. 1977, ApJS, 35, 419 [NASA ADS] [CrossRef] [Google Scholar]
- Rosen, S. R., Webb, N. A., Watson, M. G., et al. 2016, A&A, 590, A1 [NASA ADS] [CrossRef] [EDP Sciences] [Google Scholar]
- Skrutskie, M. F., Cutri, R. M., Stiening, R., et al. 2006, AJ, 131, 1163 [NASA ADS] [CrossRef] [Google Scholar]
- Snowden, S., & Kuntz, K. 2014, Cookbook for analysis procedures for XMM-Newton EPIC observations of extended objects and the diffuse background, Tech. report [Google Scholar]
- Willis, A. G. 1973, A&A, 26, 237 [NASA ADS] [Google Scholar]
- Wilms, J., Allen, A., & McCray, R. 2000, ApJ, 542, 914 [NASA ADS] [CrossRef] [Google Scholar]
See description of Fermi/LAT response functions
Available at https://fermi.gsfc.nasa.gov/ssc/data/access/lat/fl8y/
All Tables
Best fit parameters of the SNR emission modeled as optically thin single temperature plasma (Raymond & Smith 1977).
Properties of the non-FL8Y-catalogue sources used in the Fermi/LAT data analysis.
All Figures
|
Fig. 1 Background-subtracted (quiescent particle background and soft-proton background only), exposure-corrected and adaptively smoothed pseudo-color map covering region of SNR 3C434.1 as observed with XMM-Newton PN and MOS cameras (linear scaling) in soft (0.5–2.4 keV, red) and hard (2.4–7 keV, blue) bands. Contours corresponding to radio emission as observed in the CGPS 1420 Mhz map (white), and regions used for X-ray spectral analysis (solid green circle with radius of 10′ for the thermal emission, the region outside the dashed circle for the corresponding background, and yellow circle for the non-thermal emission (radius of 2.5′) are also shown. |
| In the text | |
|
Fig. 2 Background-subtracted EPIC PN spectra of entire shell (black) and of hard filament in southern part of the shell (red). The background for both spectra was estimated from best-fit model for presentation purposes only, and actual modeling was done by simultaneously fitting source and off-source regions as described in the text. |
| In the text | |
|
Fig. 3 Test statistics (TS) map of the 7° × 7° region around SNR 3C434.1 in the 1–10 GeV band as observed with Fermi/LAT. FL8Y catalogue sources (green symbols) were included into the model of the region and thus are not visible in the map. The positions of non-catalogue sources detected within the analysis are shown with cyan circles. |
| In the text | |
|
Fig. 4 Fermi/LAT spectrum (red points) of the source spatially coinciding with SNR 3C434.1. XMM-Newton spectra of the hard filament in the southern part of the shell are shown with black and blue points. |
| In the text | |
Current usage metrics show cumulative count of Article Views (full-text article views including HTML views, PDF and ePub downloads, according to the available data) and Abstracts Views on Vision4Press platform.
Data correspond to usage on the plateform after 2015. The current usage metrics is available 48-96 hours after online publication and is updated daily on week days.
Initial download of the metrics may take a while.