Fig. 2
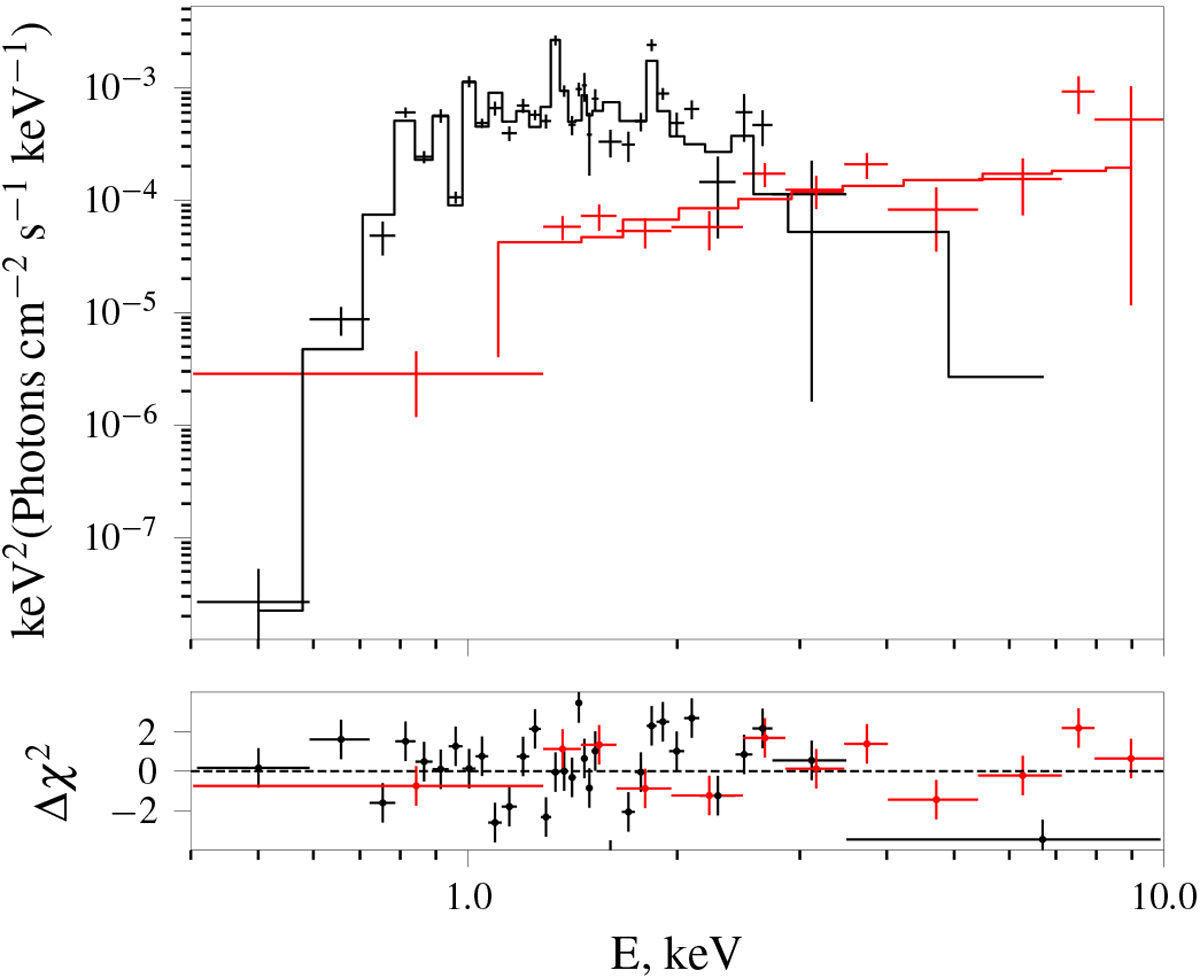
Background-subtracted EPIC PN spectra of entire shell (black) and of hard filament in southern part of the shell (red). The background for both spectra was estimated from best-fit model for presentation purposes only, and actual modeling was done by simultaneously fitting source and off-source regions as described in the text.
Current usage metrics show cumulative count of Article Views (full-text article views including HTML views, PDF and ePub downloads, according to the available data) and Abstracts Views on Vision4Press platform.
Data correspond to usage on the plateform after 2015. The current usage metrics is available 48-96 hours after online publication and is updated daily on week days.
Initial download of the metrics may take a while.