Fig. 1
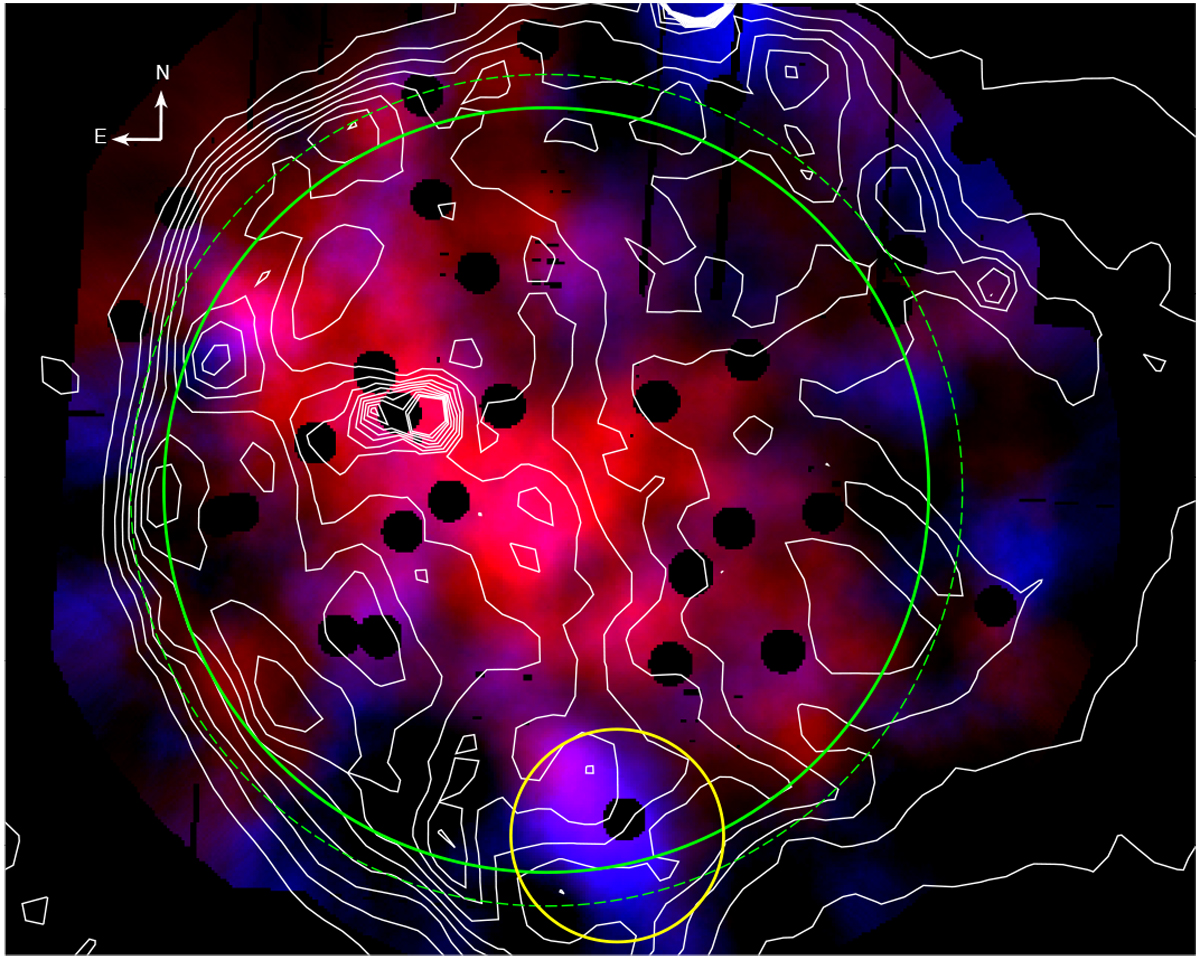
Background-subtracted (quiescent particle background and soft-proton background only), exposure-corrected and adaptively smoothed pseudo-color map covering region of SNR 3C434.1 as observed with XMM-Newton PN and MOS cameras (linear scaling) in soft (0.5–2.4 keV, red) and hard (2.4–7 keV, blue) bands. Contours corresponding to radio emission as observed in the CGPS 1420 Mhz map (white), and regions used for X-ray spectral analysis (solid green circle with radius of 10′ for the thermal emission, the region outside the dashed circle for the corresponding background, and yellow circle for the non-thermal emission (radius of 2.5′) are also shown.
Current usage metrics show cumulative count of Article Views (full-text article views including HTML views, PDF and ePub downloads, according to the available data) and Abstracts Views on Vision4Press platform.
Data correspond to usage on the plateform after 2015. The current usage metrics is available 48-96 hours after online publication and is updated daily on week days.
Initial download of the metrics may take a while.