Fig. 5.
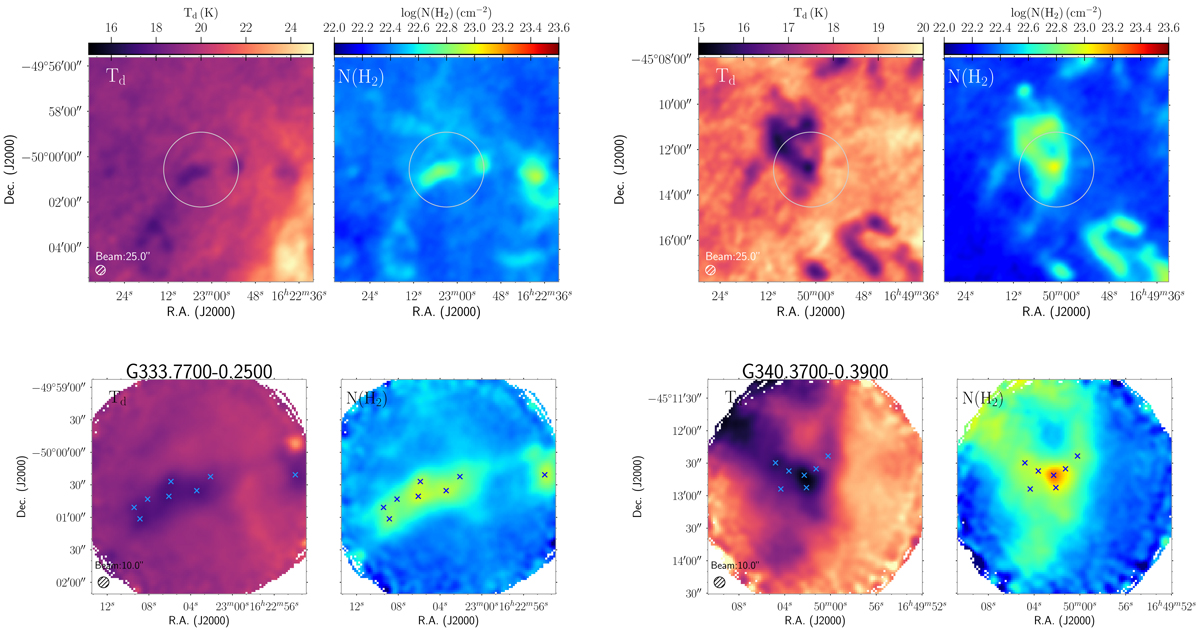
Top panels: dust temperature (Td) and H2 column density (NH2) maps obtained with a pixel-by-pixel SED fitting of PACS 160 μm, SPIRE 250, 350 μm, and combined LABOCA and Planck 870 μm data at 25″ resolution. Bottom panels: same as the top panels, but using the PACS 70 μm and the SABOCA and SPIRE 350 μm combined maps at 10″ resolution. The top and bottom panels are in same color scale for dust temperature and column density maps, respectively. The circles in the top panel indicate the region mapped by SABOCA.
Current usage metrics show cumulative count of Article Views (full-text article views including HTML views, PDF and ePub downloads, according to the available data) and Abstracts Views on Vision4Press platform.
Data correspond to usage on the plateform after 2015. The current usage metrics is available 48-96 hours after online publication and is updated daily on week days.
Initial download of the metrics may take a while.