Table 4.
Fraction of systems (column two, three & four in %) of 202 investigated mock systems (101 doubles and 101 quads) where time delay has been measured with accuracy smaller than 1% and precision smaller than 5% for using LSST as a discovery machine and getting time delays from follow-up observations.
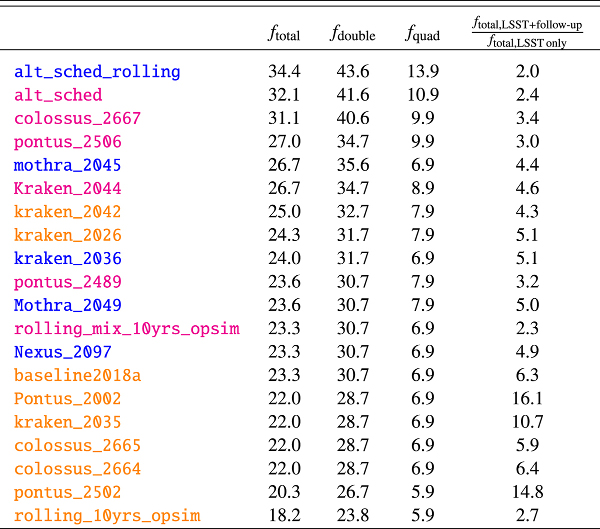
Notes. The investigation has been done for the ten fields listed in Table 1. The 5th column shows how much better a cadence performs in comparison to using LSST data only. This table is insufficient to rank different cadence strategies because the total number of detected LSNe Ia is not taken into account.
Current usage metrics show cumulative count of Article Views (full-text article views including HTML views, PDF and ePub downloads, according to the available data) and Abstracts Views on Vision4Press platform.
Data correspond to usage on the plateform after 2015. The current usage metrics is available 48-96 hours after online publication and is updated daily on week days.
Initial download of the metrics may take a while.