Table 2.
Total number of LSNe Ia over 10-year survey calculated via Eq. (24) where 69% are doubles and 31% are quads.
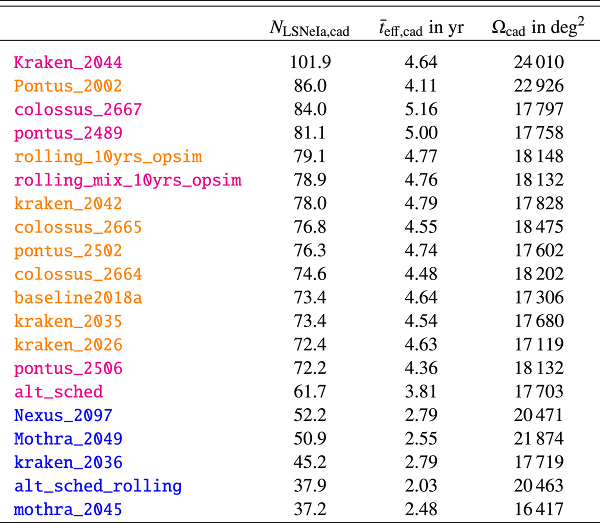
Notes. To understand the differences between the multiple strategies also the cumulative season length ![]() and the survey area Ωcad are shown. The total number depends on the selection criteria assumed in Oguri & Marshall (2010). If we relax the criteria like the image separation these numbers will be higher, but the order will be unchanged. Since differences in
and the survey area Ωcad are shown. The total number depends on the selection criteria assumed in Oguri & Marshall (2010). If we relax the criteria like the image separation these numbers will be higher, but the order will be unchanged. Since differences in ![]() are much larger than in Ωcad the cumulative season length mostly sets the order of the table.
are much larger than in Ωcad the cumulative season length mostly sets the order of the table.
Current usage metrics show cumulative count of Article Views (full-text article views including HTML views, PDF and ePub downloads, according to the available data) and Abstracts Views on Vision4Press platform.
Data correspond to usage on the plateform after 2015. The current usage metrics is available 48-96 hours after online publication and is updated daily on week days.
Initial download of the metrics may take a while.