Fig. 9.
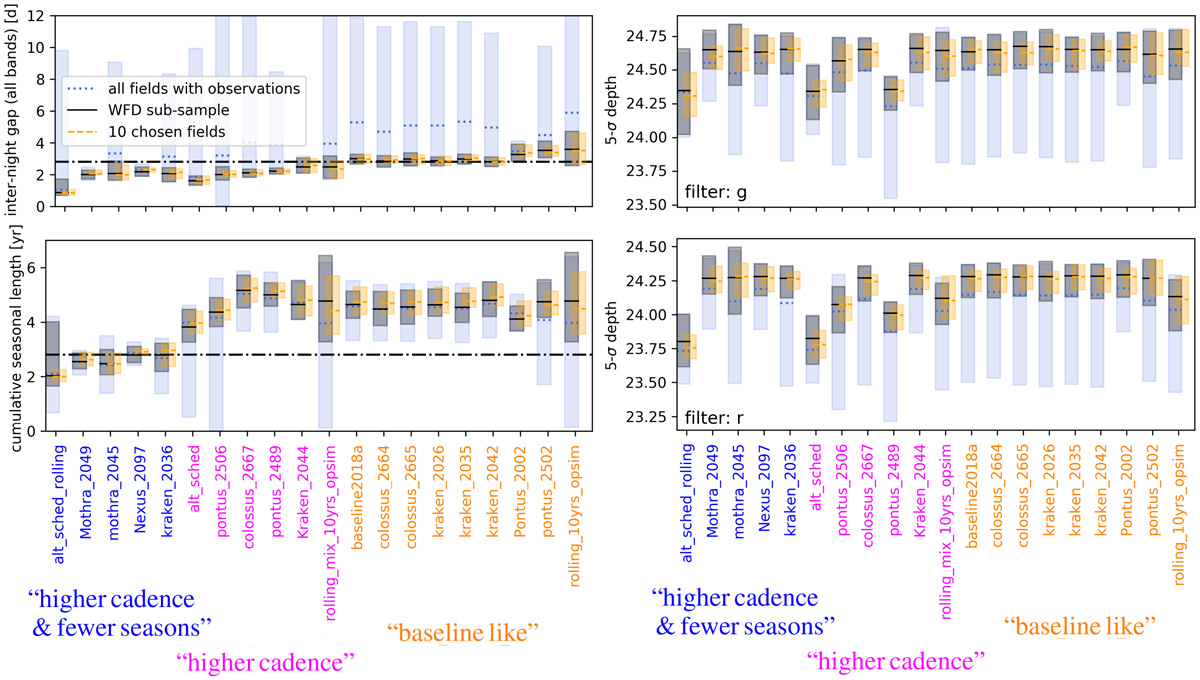
Comparison of inter-night gap, cumulative season length, and 5σ depth of ten fields under investigation (orange) to sample of 719 WFD (black) fields. In addition, all 5292 LSST fields where observations are taken (blue) are shown. The lines indicate the mean and the shaded area includes everything up to the 99th percentile. We see that the ten chosen fields are representative for the WFD survey but not for the whole survey.
Current usage metrics show cumulative count of Article Views (full-text article views including HTML views, PDF and ePub downloads, according to the available data) and Abstracts Views on Vision4Press platform.
Data correspond to usage on the plateform after 2015. The current usage metrics is available 48-96 hours after online publication and is updated daily on week days.
Initial download of the metrics may take a while.