Fig. 6.
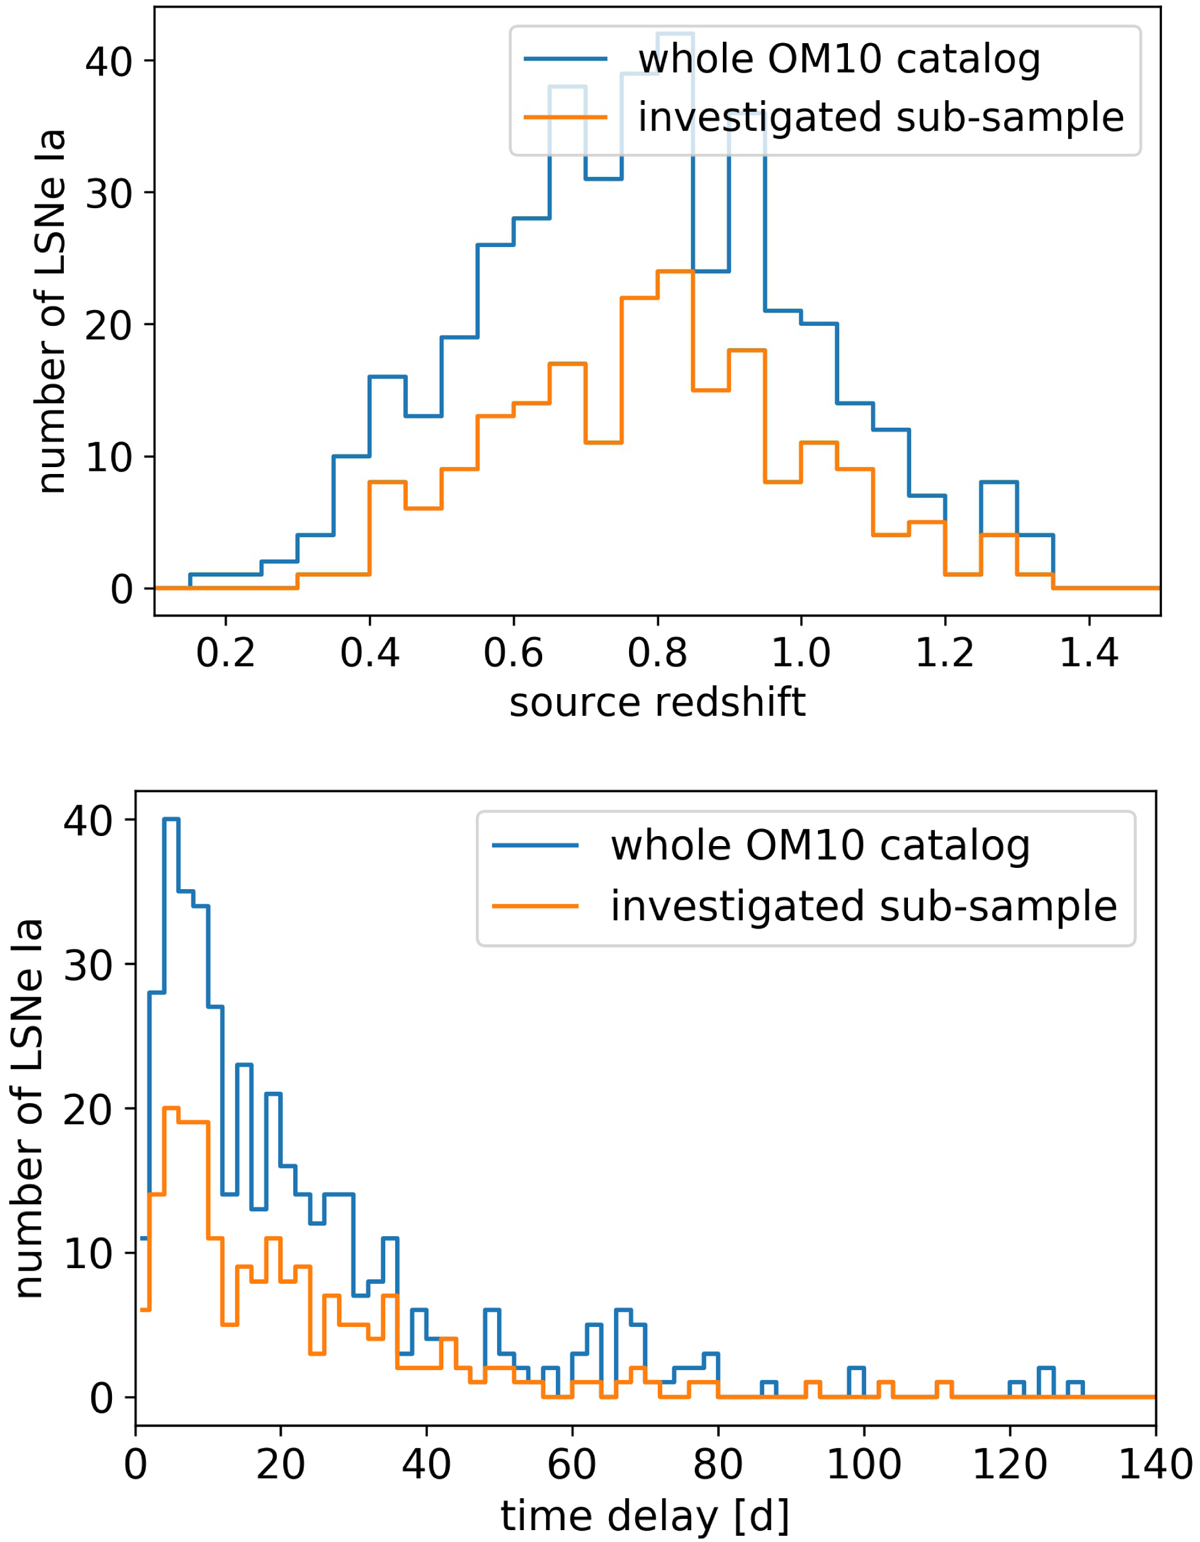
Source redshift (upper panel) and time-delay (lower panel) distribution of LSNe Ia from the OM10 catalog. The blue line shows the whole catalog (417 mock systems). The orange line shows the subsample of 202 mock systems (101 randomly picked quads and 101 randomly picked doubles) under investigations in Sect. 6. For the time-delay distribution, the maximum time delay is shown (just relevant for quads) and there are three systems not in the plot with time delays greater than 140 days. The highest delay of a LSNe Ia in the OM10 catalog is 290 days.
Current usage metrics show cumulative count of Article Views (full-text article views including HTML views, PDF and ePub downloads, according to the available data) and Abstracts Views on Vision4Press platform.
Data correspond to usage on the plateform after 2015. The current usage metrics is available 48-96 hours after online publication and is updated daily on week days.
Initial download of the metrics may take a while.