Fig. C.1.
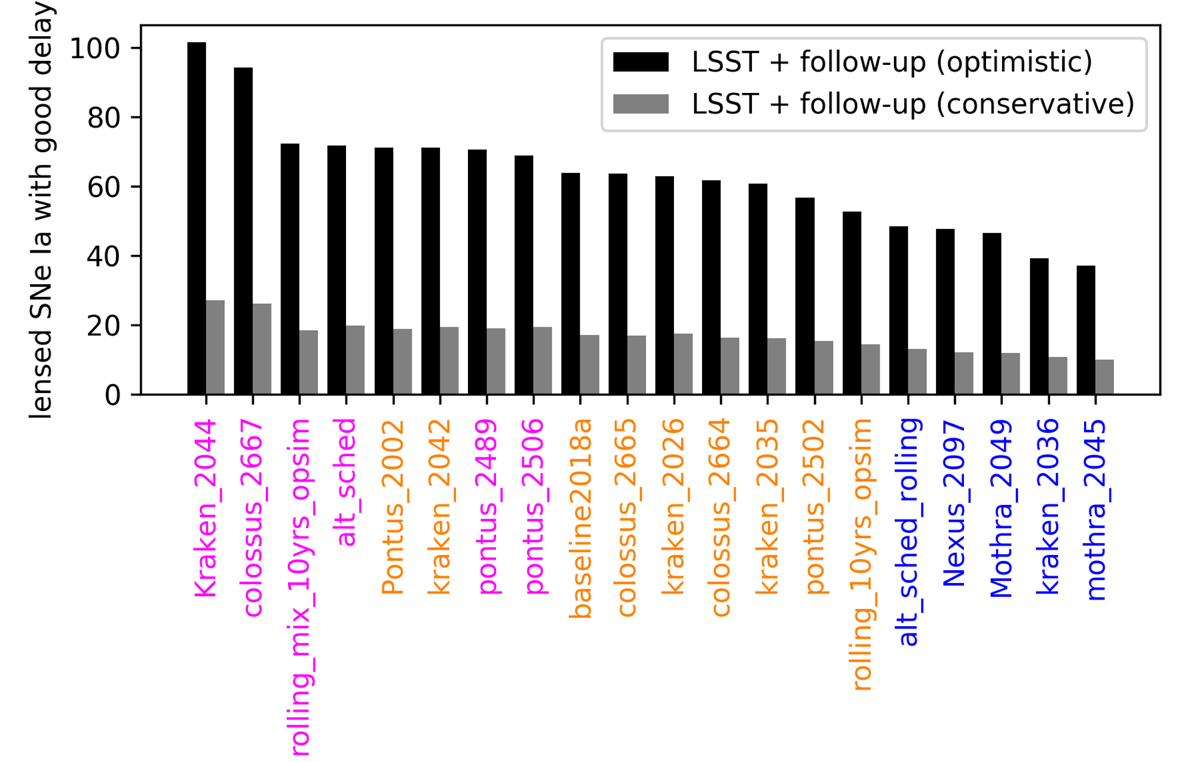
Number of LSNe Ia with well measured time delay for 10-year survey including faint systems with i-band peak magnitude (of fainter image in doubles, or third brightest image in quads) fainter than 22.6 mag (black bars), in comparison to results presented in Fig. 14 (gray bars). We see that the optimistic (black bars) and conservative (gray bars) estimates show the same trend for magenta, orange and blue cadence strategies.
Current usage metrics show cumulative count of Article Views (full-text article views including HTML views, PDF and ePub downloads, according to the available data) and Abstracts Views on Vision4Press platform.
Data correspond to usage on the plateform after 2015. The current usage metrics is available 48-96 hours after online publication and is updated daily on week days.
Initial download of the metrics may take a while.