Fig. A.5.
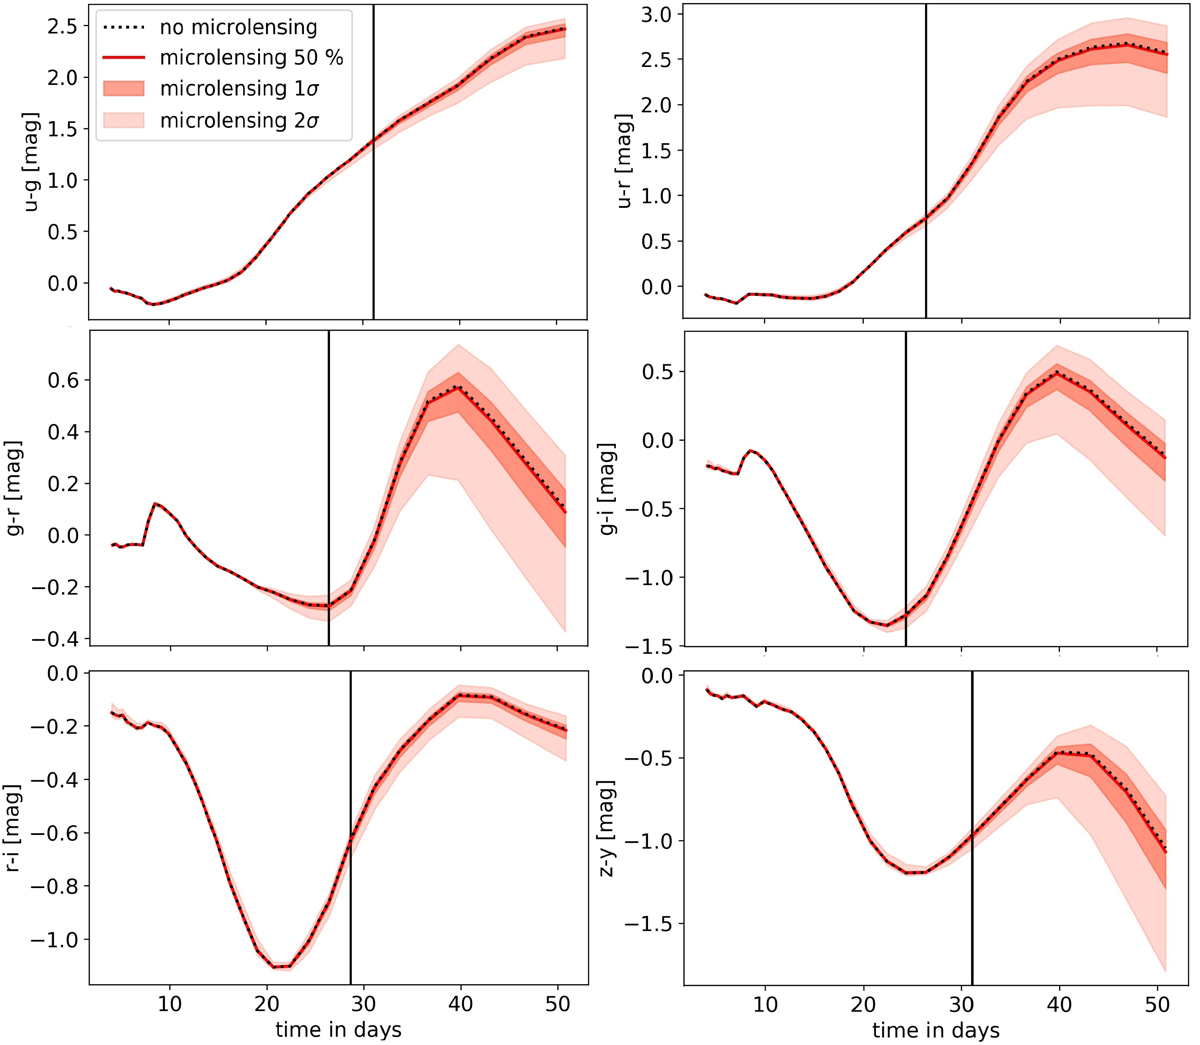
Comparison of non-microlensed color curves (dotted black) to microlensed ones (with median in solid red, and 1σ and 2σ range in different shades), for 10 000 random SNe positions in magnification map. The vertical black line indicates the first time the 2σ spread of the microlensed color curves exceeds 0.1 magnitudes. The panels are all rest-frame LSST color curves for a saddle image (κ = 0.6, γ = 0.6, and s = 0.6, see Fig. 1), which show an achromatic phase similar to the one reported by Goldstein et al. (2018), but we find the achromatic phase only for combinations of the bands u, g, r, and i (except u − i) and for the color curve z − y up to approximately 25 − 30 days after explosion.
Current usage metrics show cumulative count of Article Views (full-text article views including HTML views, PDF and ePub downloads, according to the available data) and Abstracts Views on Vision4Press platform.
Data correspond to usage on the plateform after 2015. The current usage metrics is available 48-96 hours after online publication and is updated daily on week days.
Initial download of the metrics may take a while.