Fig. 15.
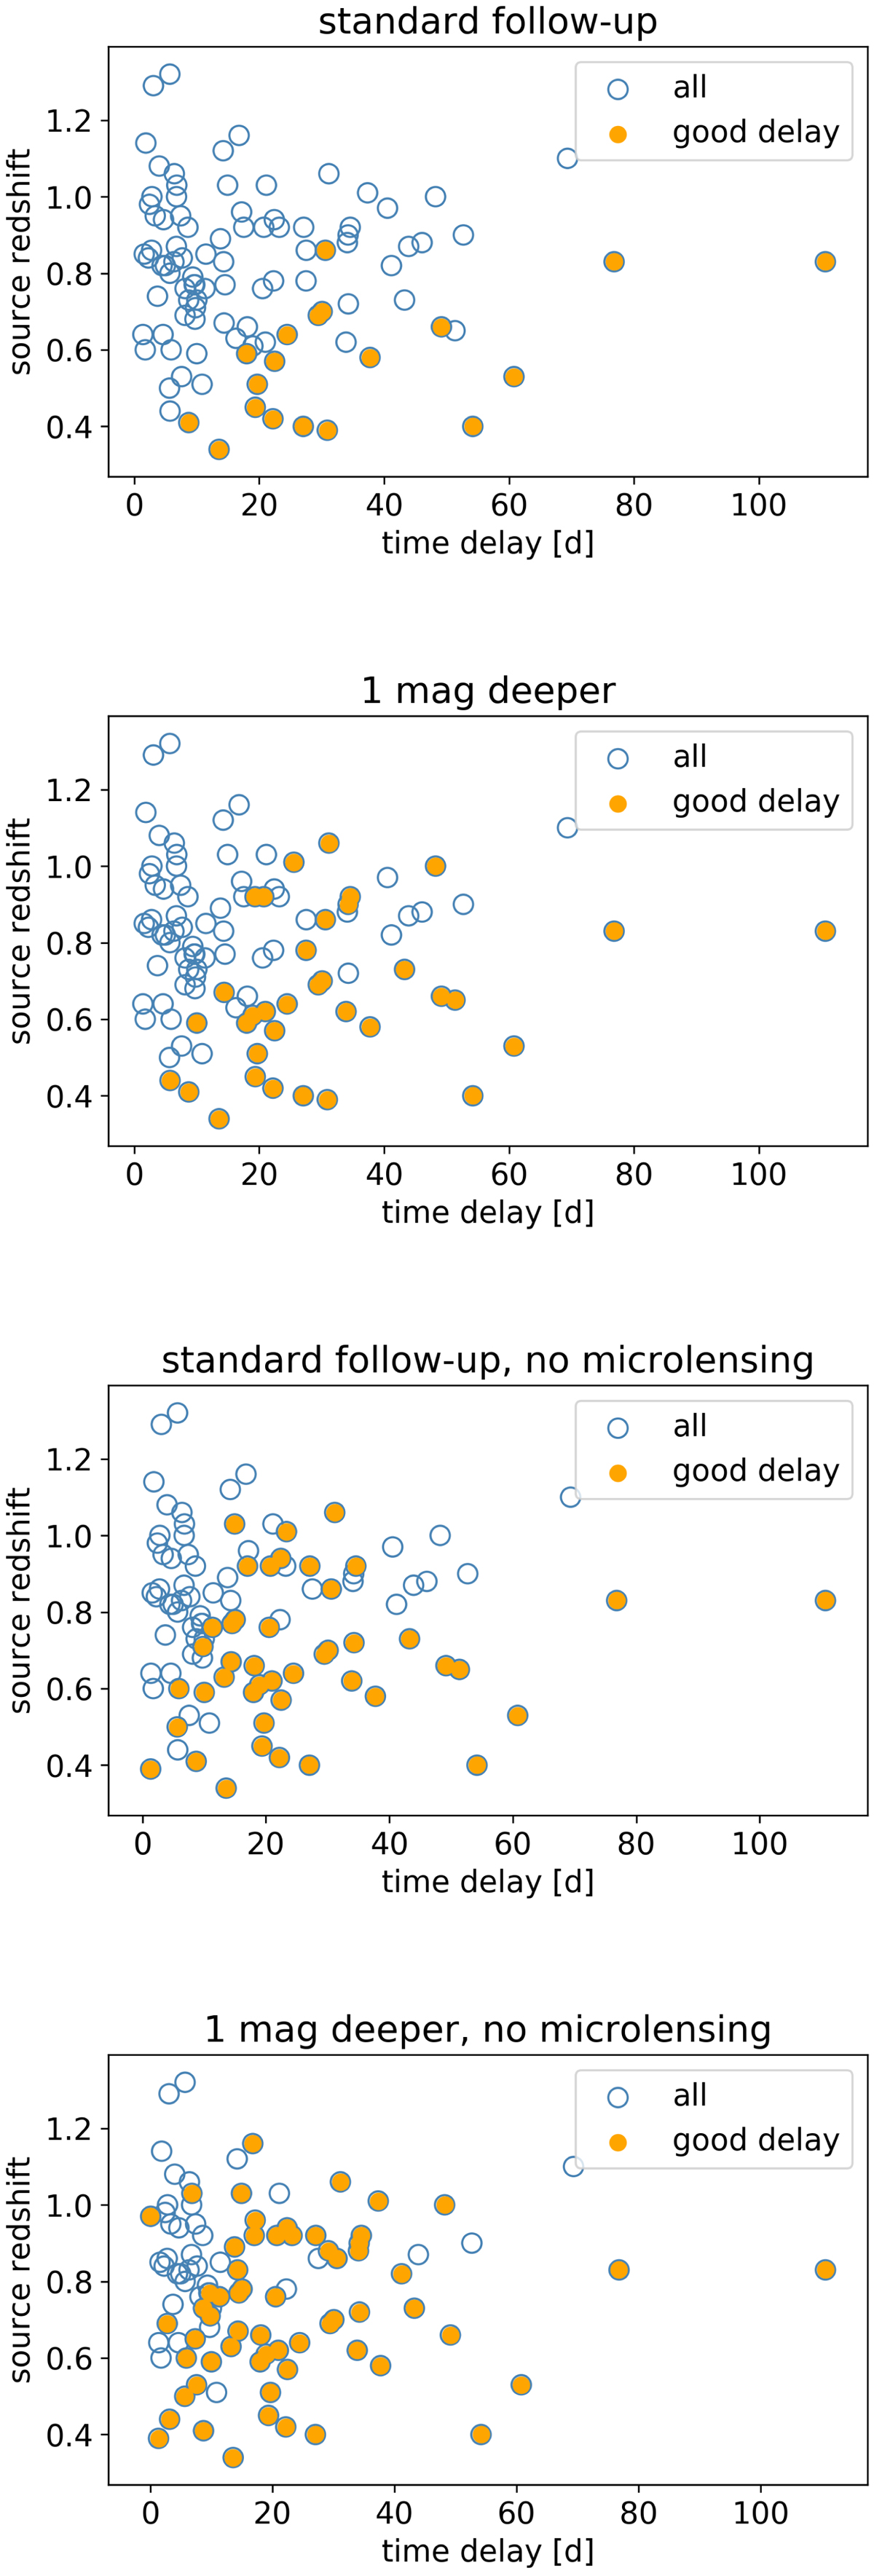
Time-delay and source-redshift distribution for 100 investigated mock LSNe for baseline2018a, similar to Fig. 12. Upper two panels: standard follow-up observation (first panel) and the option going one magnitude deeper (second panel). Lower two panels: same follow-up scenarios hypothetically without microlensing. The distributions vary slightly because for a quad system just a single time delay is shown, either the first successfully measured delay or the maximum of the six possible delays.
Current usage metrics show cumulative count of Article Views (full-text article views including HTML views, PDF and ePub downloads, according to the available data) and Abstracts Views on Vision4Press platform.
Data correspond to usage on the plateform after 2015. The current usage metrics is available 48-96 hours after online publication and is updated daily on week days.
Initial download of the metrics may take a while.