Fig. 14.
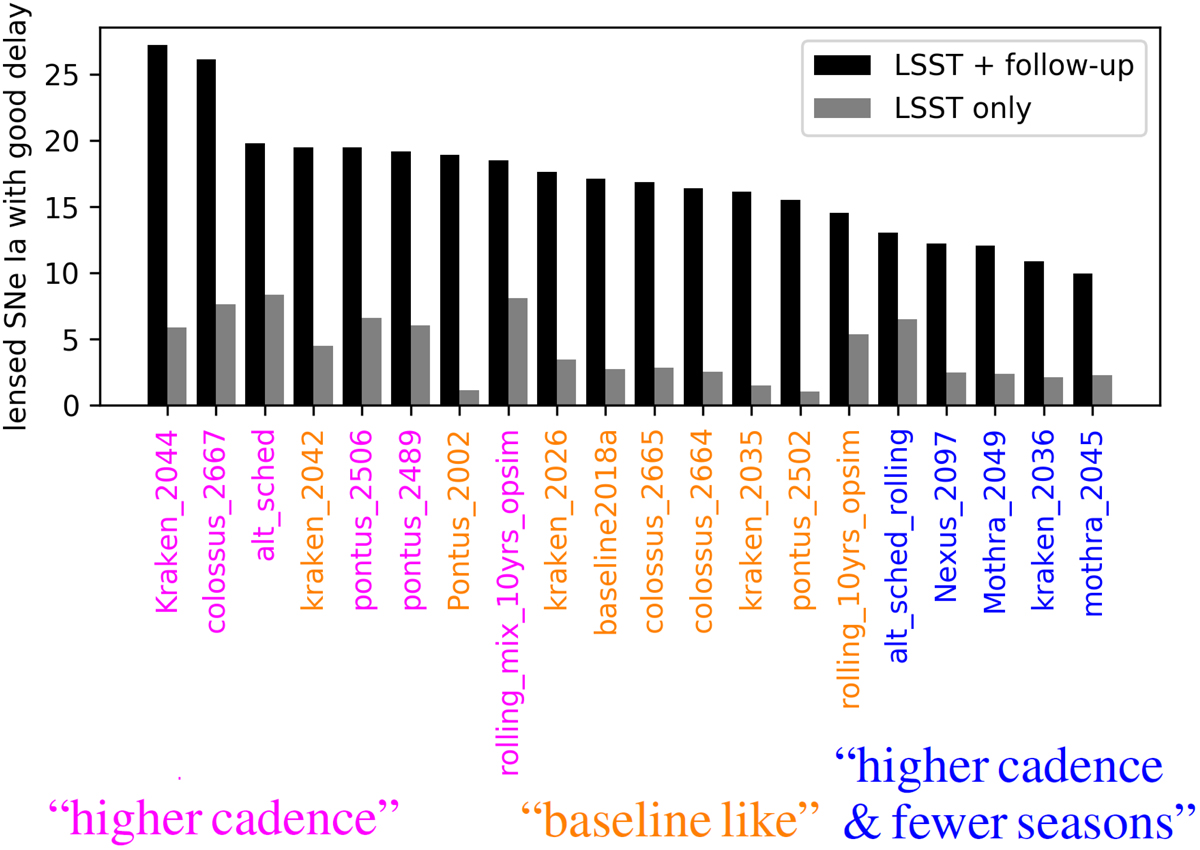
Number of LSNe Ia for 10-year survey where time delay has been measured with accuracy < 1% and precision < 5% by using LSST as discovery machine in combination with follow-up observations for measuring time delays (black bars) and using only LSST data (gray bars, see also Fig. 11). Follow-up is every second night in filters g, r, and i, starting two nights after third LSST detection (with brightness exceeding 5σ depth in any filter). With follow-up observations, we get a substantial increase in the number of LSNe Ia systems with good measured delays. The numbers shown in this figure are a conservative estimate. An optimistic approach is discussed in Appendix C, leading to the same overall conclusion about the categories of cadence strategies (magenta, orange, and blue) but providing about 3.5 times more LSNe Ia with well-measured delays.
Current usage metrics show cumulative count of Article Views (full-text article views including HTML views, PDF and ePub downloads, according to the available data) and Abstracts Views on Vision4Press platform.
Data correspond to usage on the plateform after 2015. The current usage metrics is available 48-96 hours after online publication and is updated daily on week days.
Initial download of the metrics may take a while.