Open Access
Fig. 13.
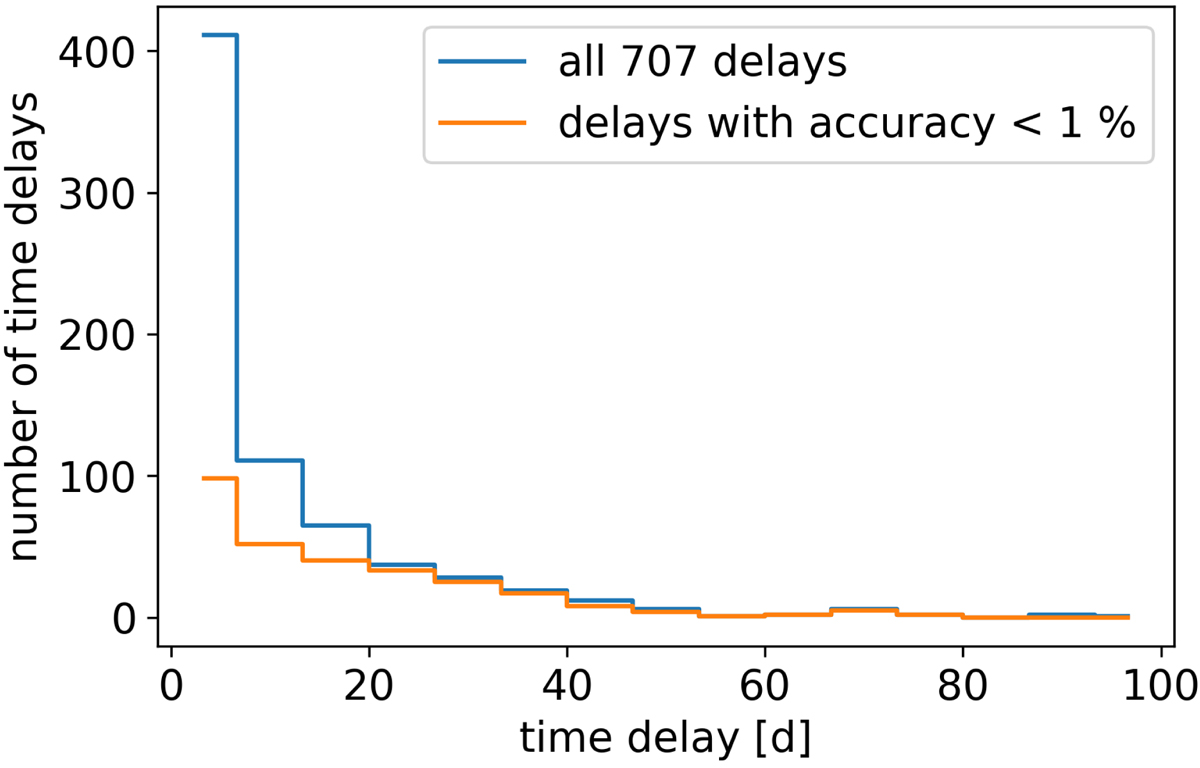
Duration distribution for all 707 possible time delays (blue) and time delays with accuracy better than 1% (orange) from 202 investigated systems for “LSST + follow-up” and observing strategy colossus_2667. Nearly all time delays are accurate for pairs of images which yield a time delay greater than 20 days.
Current usage metrics show cumulative count of Article Views (full-text article views including HTML views, PDF and ePub downloads, according to the available data) and Abstracts Views on Vision4Press platform.
Data correspond to usage on the plateform after 2015. The current usage metrics is available 48-96 hours after online publication and is updated daily on week days.
Initial download of the metrics may take a while.