Fig. 12.
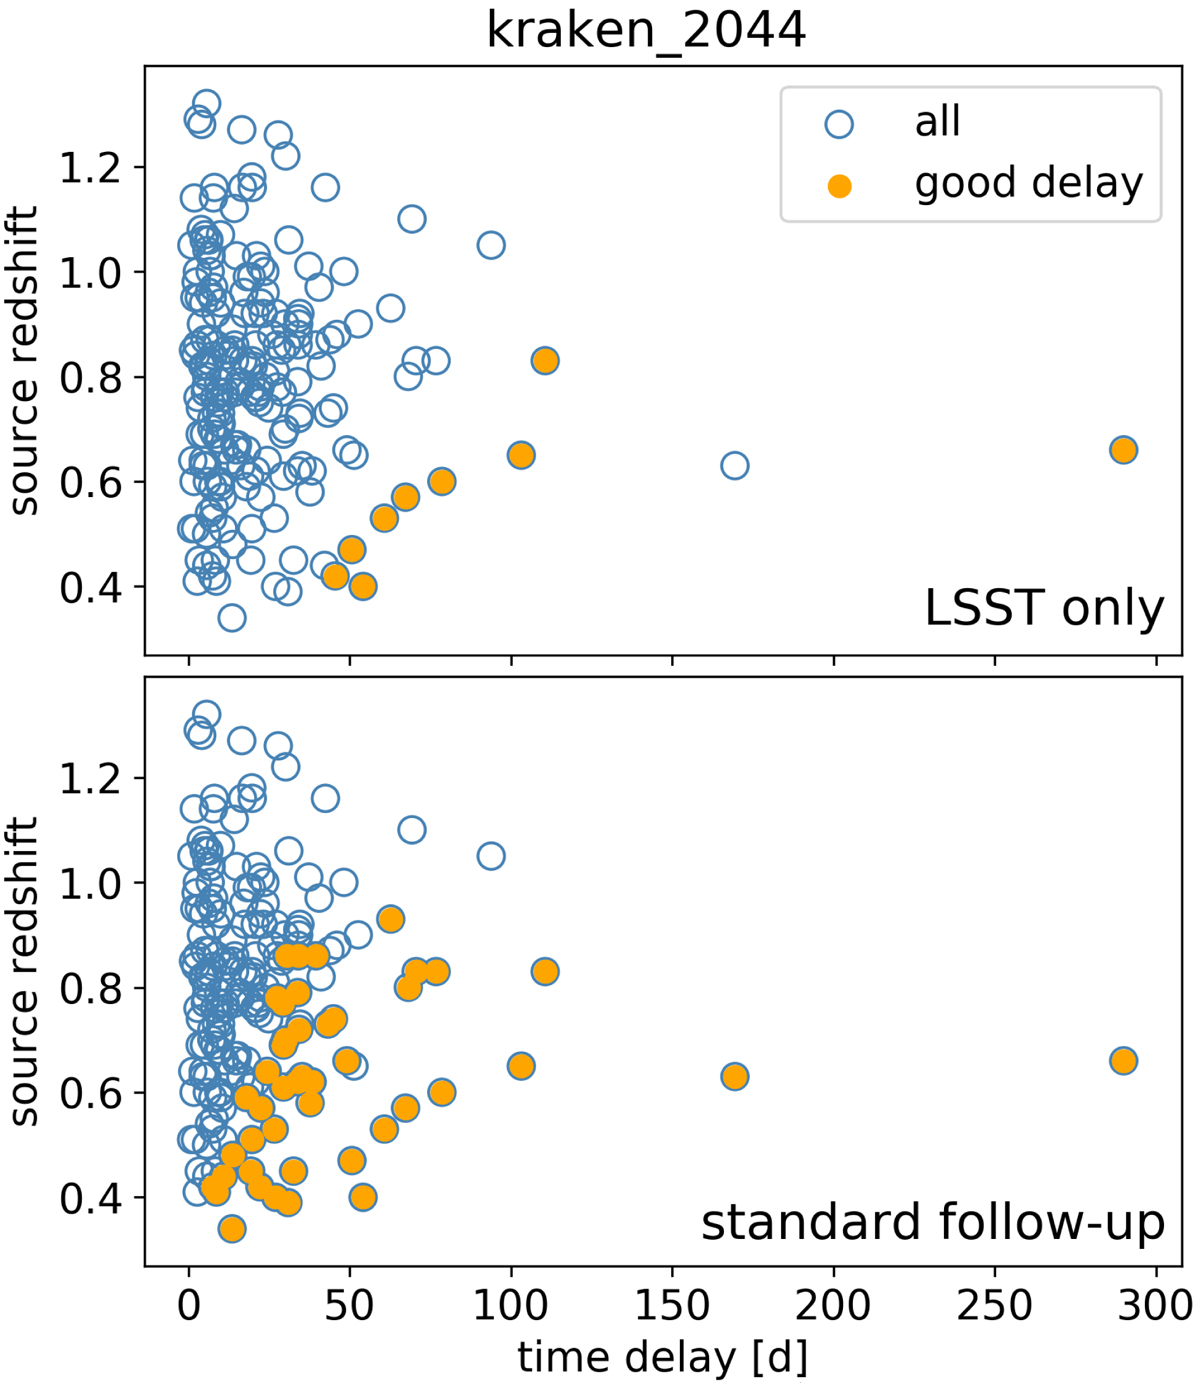
Time-delay and source-redshift distribution for 202 investigated mock LSNe Ia for “LSST only” (upper panel) and “LSST + follow-up” (lower panel) for observing strategy kraken_2044. For a quad system, just a single delay is shown, either the first successful measured time-delay or the maximum of the six possible time delays. The blue circles show all 202 investigated systems and the orange filled dots correspond to systems where the time delay has been measured with accuracy better than 1% and precision better than 5%. Comparing the two panels we see significant improvement going from “LSST only” to “LSST + follow-up”, which we find for most of the observing strategies as suggested by Table 4.
Current usage metrics show cumulative count of Article Views (full-text article views including HTML views, PDF and ePub downloads, according to the available data) and Abstracts Views on Vision4Press platform.
Data correspond to usage on the plateform after 2015. The current usage metrics is available 48-96 hours after online publication and is updated daily on week days.
Initial download of the metrics may take a while.