Fig. 10.
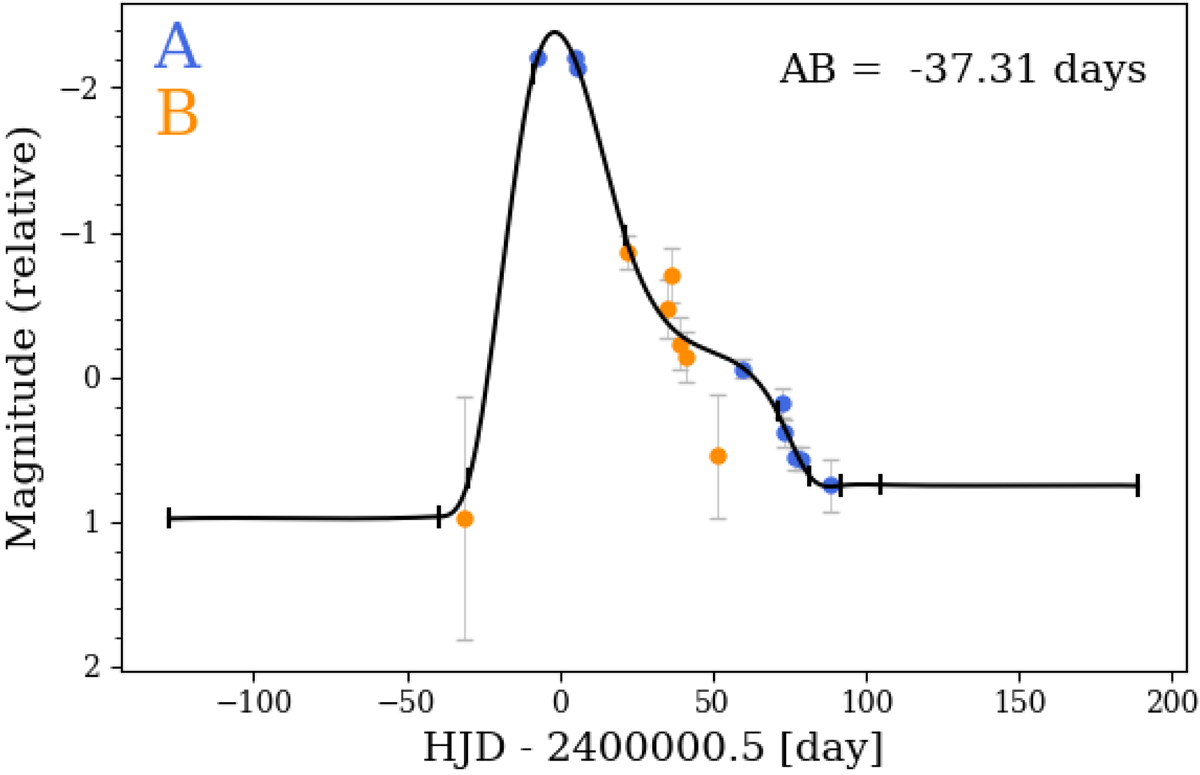
Illustration of spline fitting technique for a double mock LSNe Ia at redshift 0.27 for the i-band light curve. The black line corresponds to the spline fit of the data (blue and orange), where the knots positions (small vertical ticks on the black lines) as well as the magnitude and time shifts have been iteratively optimized to minimize a chi-square term, resulting in the measured delay indicated in the top-right.
Current usage metrics show cumulative count of Article Views (full-text article views including HTML views, PDF and ePub downloads, according to the available data) and Abstracts Views on Vision4Press platform.
Data correspond to usage on the plateform after 2015. The current usage metrics is available 48-96 hours after online publication and is updated daily on week days.
Initial download of the metrics may take a while.