Fig. 9.
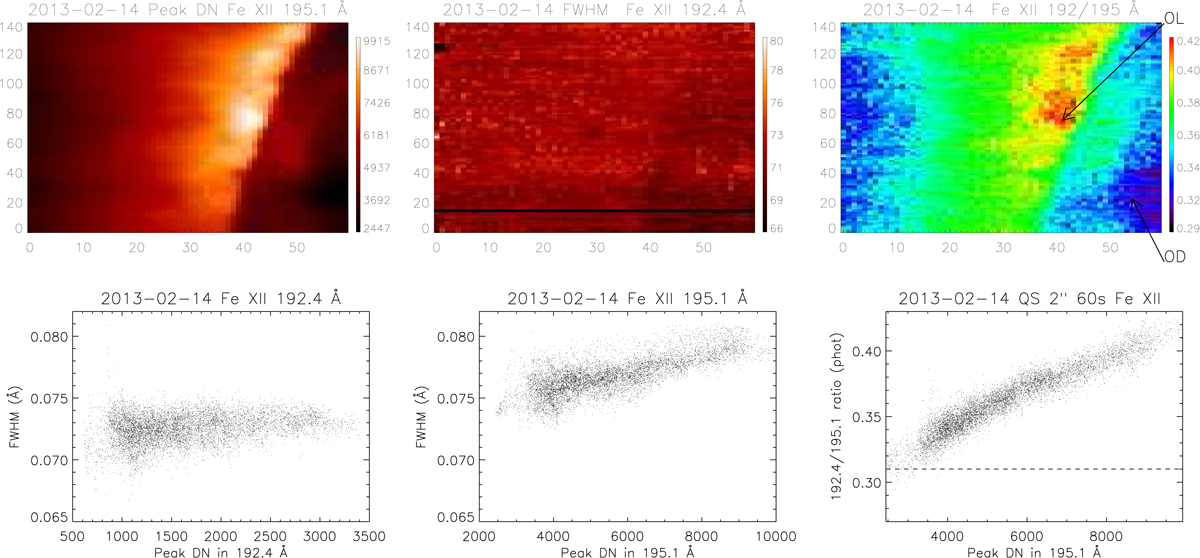
Quiet Sun east limb observation on 2013-02-14 at 09:49 UT. Top images: peak intensity of the 195 Å line (DN), the observed FWHM (Å) of the 192 Å line, and the intensity ratio of the 192 and 195 Å lines. The coordinates are the pixel positions. The arrows indicate two regions, off-limb (OL) and on-disk (OD) chosen for further studies. Lower plots: scatter plots of the FWHM in the 192 and 195 Å lines, as a function of their peak intensity, and the intensity ratio of the 192/195 Å lines. The dashed line indicate the expected value.
Current usage metrics show cumulative count of Article Views (full-text article views including HTML views, PDF and ePub downloads, according to the available data) and Abstracts Views on Vision4Press platform.
Data correspond to usage on the plateform after 2015. The current usage metrics is available 48-96 hours after online publication and is updated daily on week days.
Initial download of the metrics may take a while.