Fig. G.2.
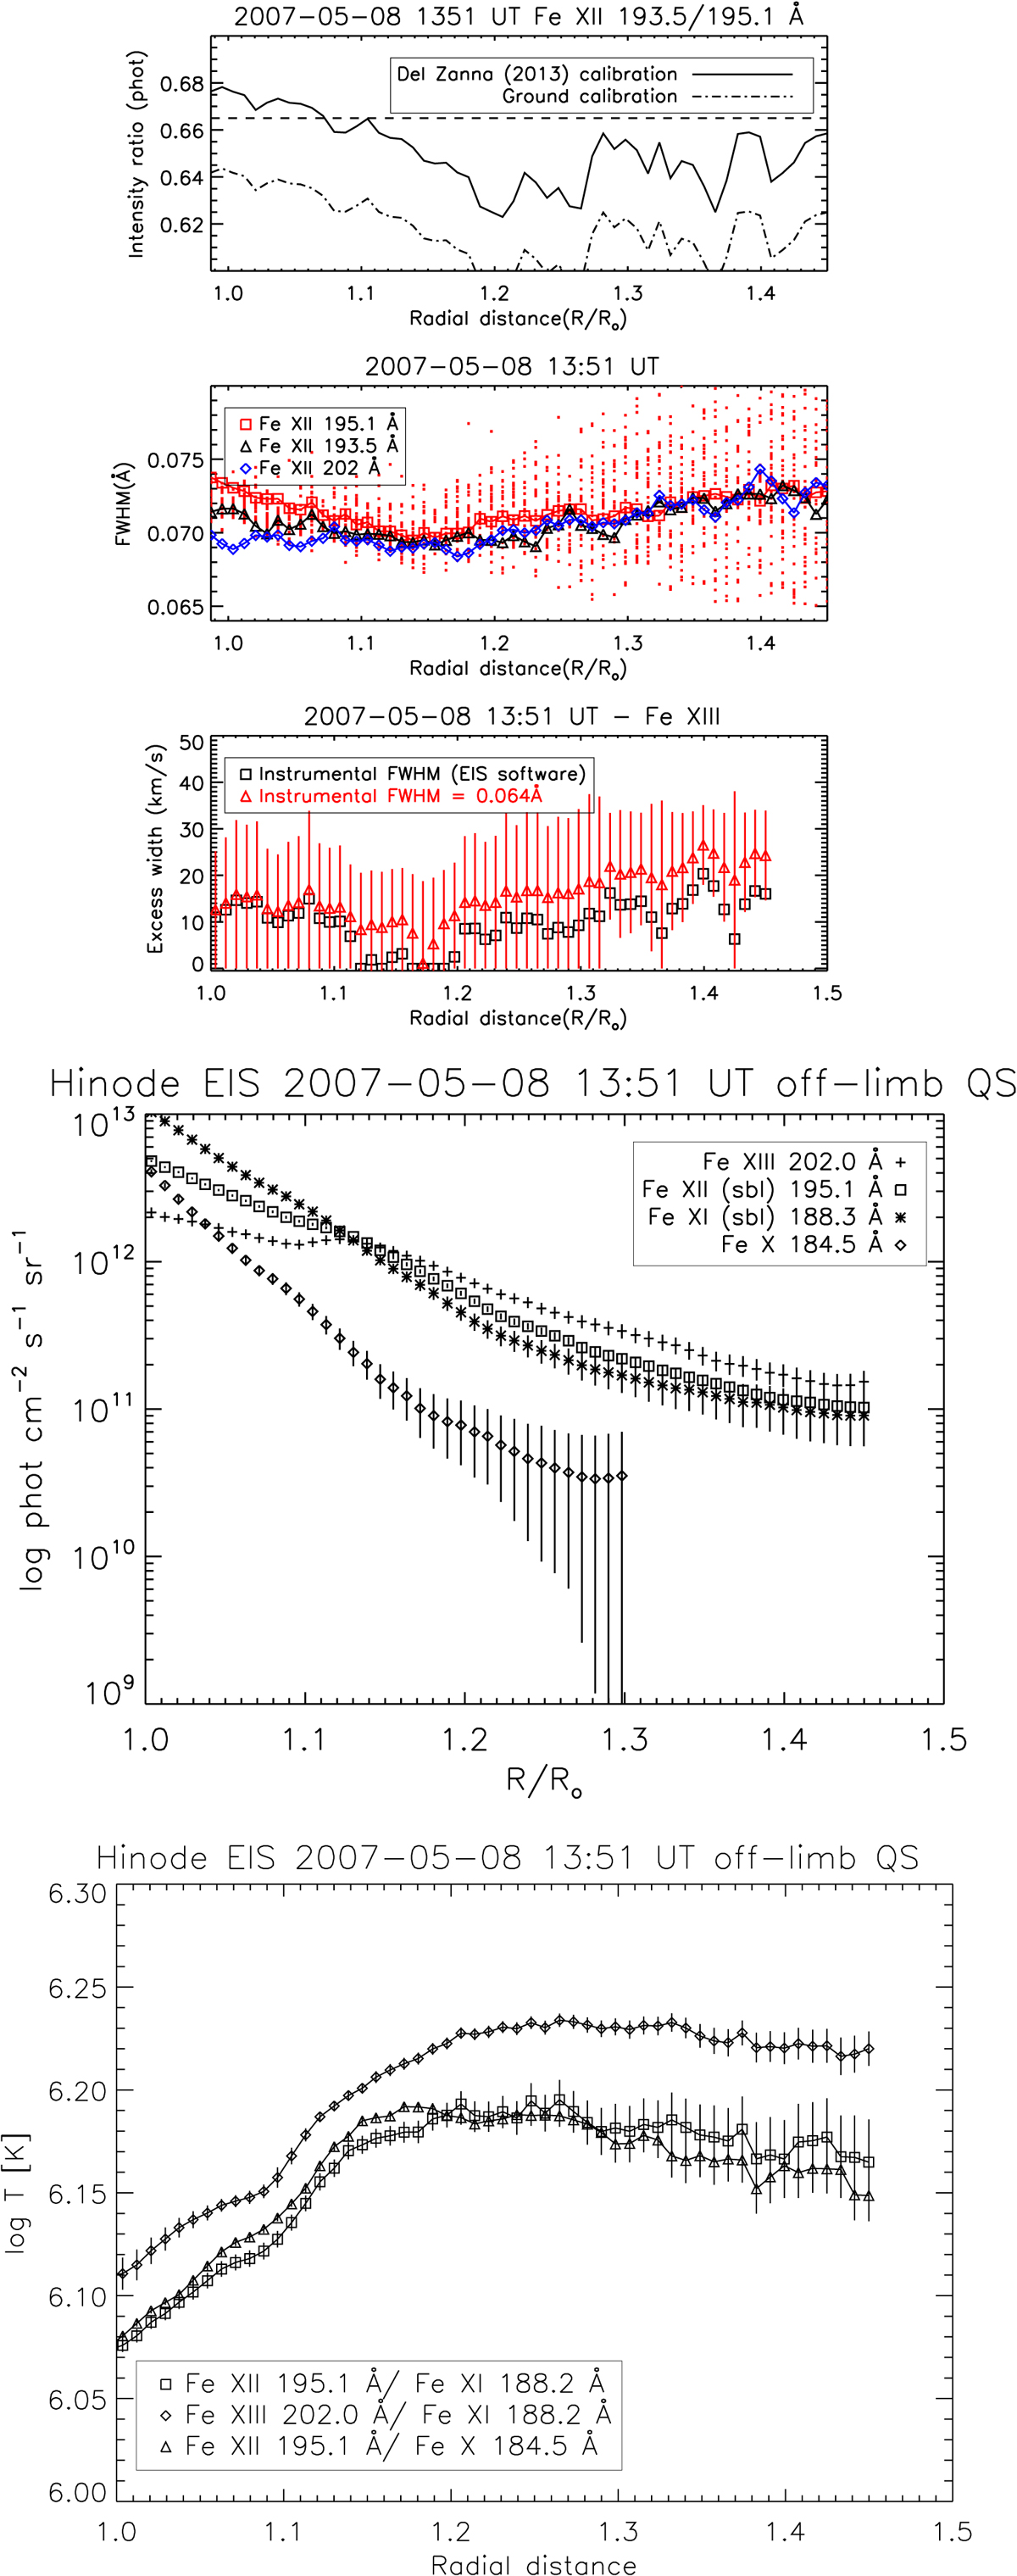
From top to bottom: measured intensity ratio of the Fe XII 193.5 versus 195.1 Å lines on 2007-05-8, as function of radial distance in the QS sector; observed FWHM of the main three lines, from averaged spectra along the radial QS sector, with the pixel-by-pixel FWHM of the 195.1 Å line (points); excess width from the Fe XIII line; radiances of selected lines along the radial QS sector; isothermal temperatures along the radial QS sector.
Current usage metrics show cumulative count of Article Views (full-text article views including HTML views, PDF and ePub downloads, according to the available data) and Abstracts Views on Vision4Press platform.
Data correspond to usage on the plateform after 2015. The current usage metrics is available 48-96 hours after online publication and is updated daily on week days.
Initial download of the metrics may take a while.