Fig. A.3.
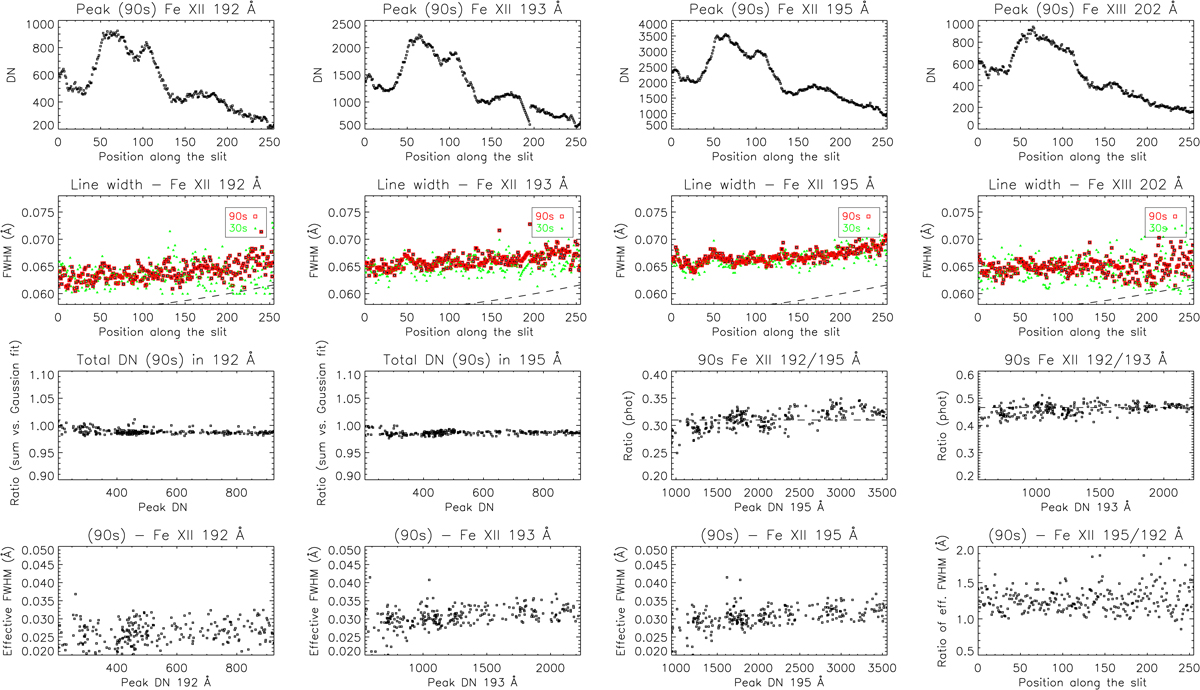
Quiet Sun SYNOP1 observations on 2007-06-09 at 06:12 UT. Top row: peak DN along the slit, from the 90 s exposures. Second row: line widths (FWHM) from the 30 and 90 s exposures. Note the larger scatter in the 30 s exposures, for low DN, below 200. Dashed lines: instrumental FWHM as in the EIS software. Third row: ratios of total counts in the 192 and 195 Å lines, as obtained by summing the pixel values and the Gaussian fit; 192/195 Å and 192/193 Å line intensity ratios from the 90 s exposures (in photons, dashed lines indicates expected values); Last row: effective FWHM in the three Fe XII lines, and the ratio of the 195 versus the 192 Å widths.
Current usage metrics show cumulative count of Article Views (full-text article views including HTML views, PDF and ePub downloads, according to the available data) and Abstracts Views on Vision4Press platform.
Data correspond to usage on the plateform after 2015. The current usage metrics is available 48-96 hours after online publication and is updated daily on week days.
Initial download of the metrics may take a while.