Fig. A.2.
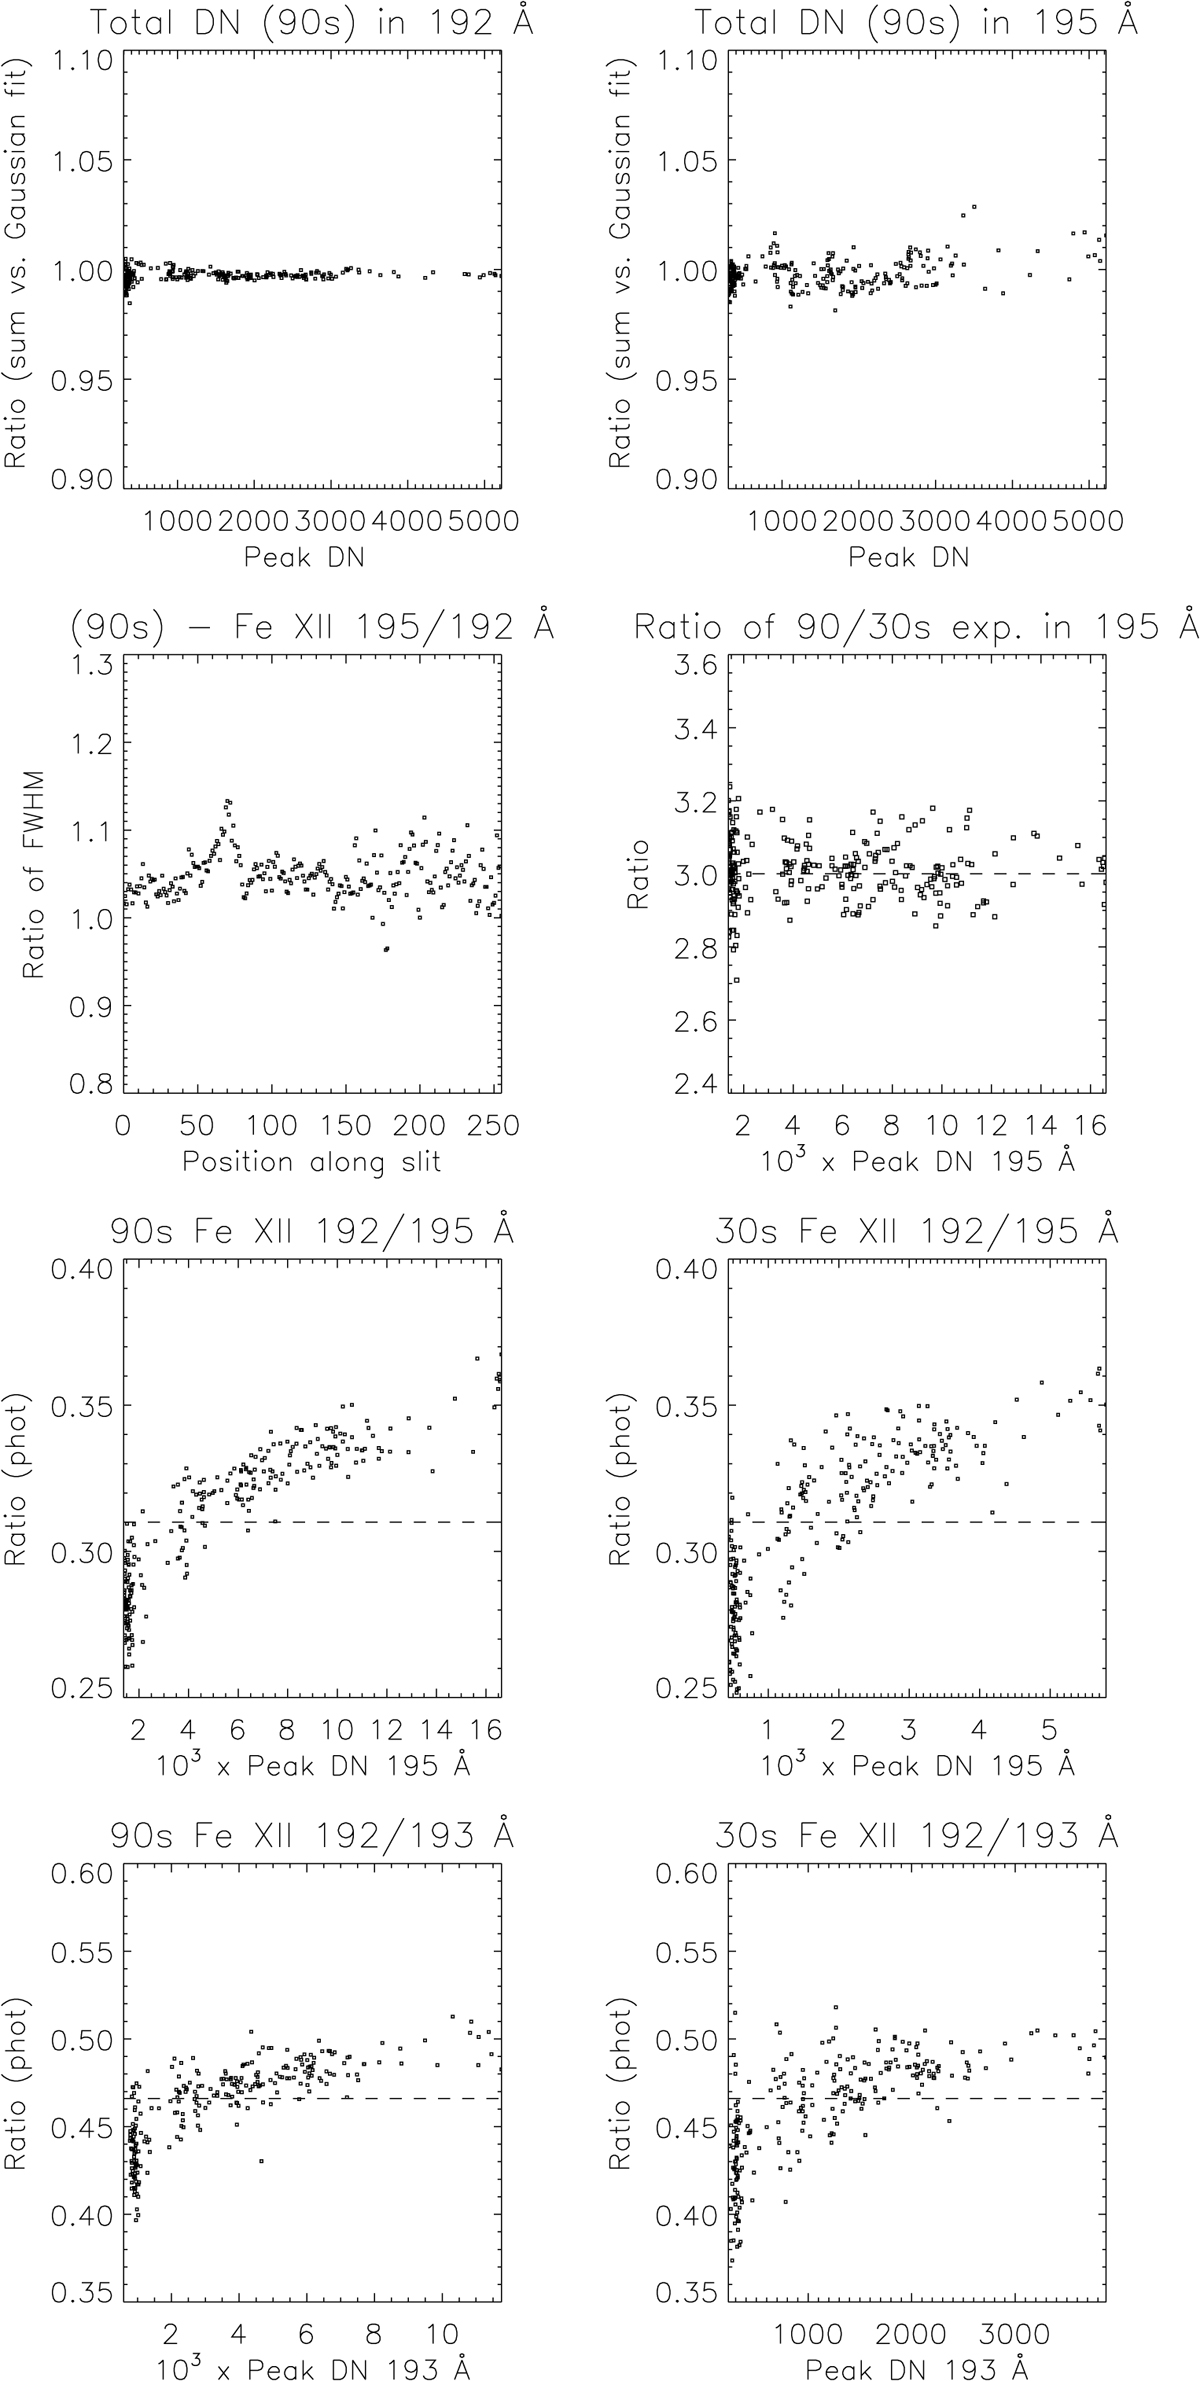
SYNOP1 single-slit observations on 2007-01-06 at 15:47 UT across an active region. From top to bottom: ratios of total counts in the 192 and 195 Å lines, as obtained by summing the pixel values and the Gaussian fit; ratio of the FWHM in the 195 versus the 192 Å lines; intensity ratio in the 195 Å line, between the 90 s and 30 s exposures; 192/195 Å and 192/193 Å line intensity ratios from the 90 s and 30 s exposures (in photons, dashed lines indicates expected values).
Current usage metrics show cumulative count of Article Views (full-text article views including HTML views, PDF and ePub downloads, according to the available data) and Abstracts Views on Vision4Press platform.
Data correspond to usage on the plateform after 2015. The current usage metrics is available 48-96 hours after online publication and is updated daily on week days.
Initial download of the metrics may take a while.