Free Access
Fig. A.1.
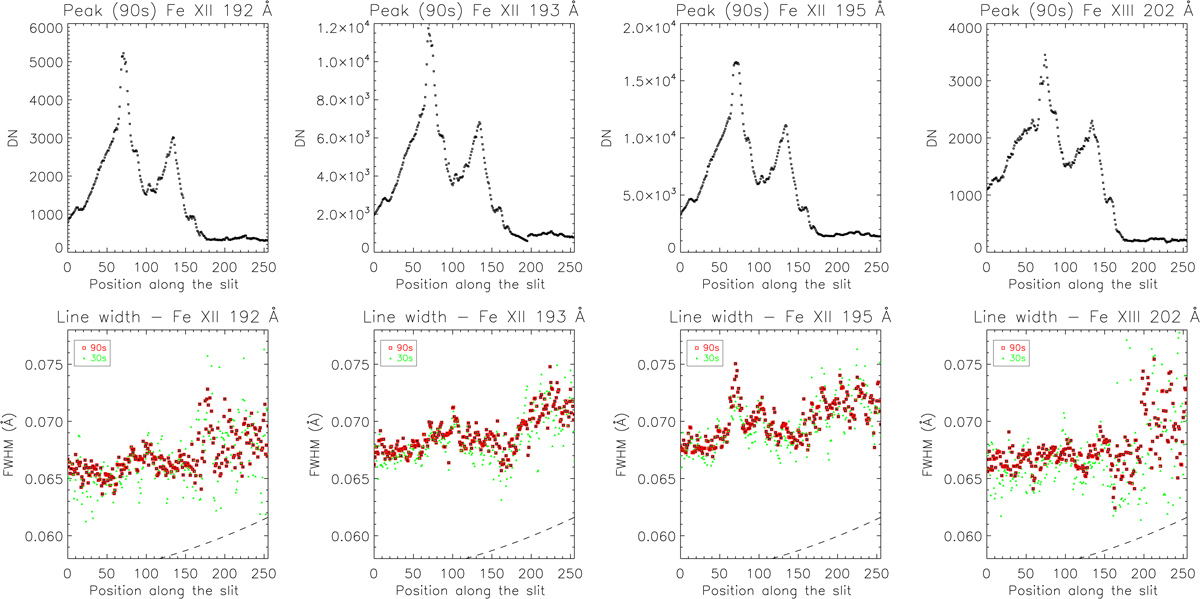
SYNOP1 single-slit observations on 2007-01-06 at 15:47 UT across an active region. Top row: peak DN along the slit, from the 90 s exposures. Bottom row: line widths (FWHM) from the 30 and 90 s exposures. The dashed line indicate the instrumental FWHM as estimated within the EIS software.
Current usage metrics show cumulative count of Article Views (full-text article views including HTML views, PDF and ePub downloads, according to the available data) and Abstracts Views on Vision4Press platform.
Data correspond to usage on the plateform after 2015. The current usage metrics is available 48-96 hours after online publication and is updated daily on week days.
Initial download of the metrics may take a while.