Free Access
Fig. 13.
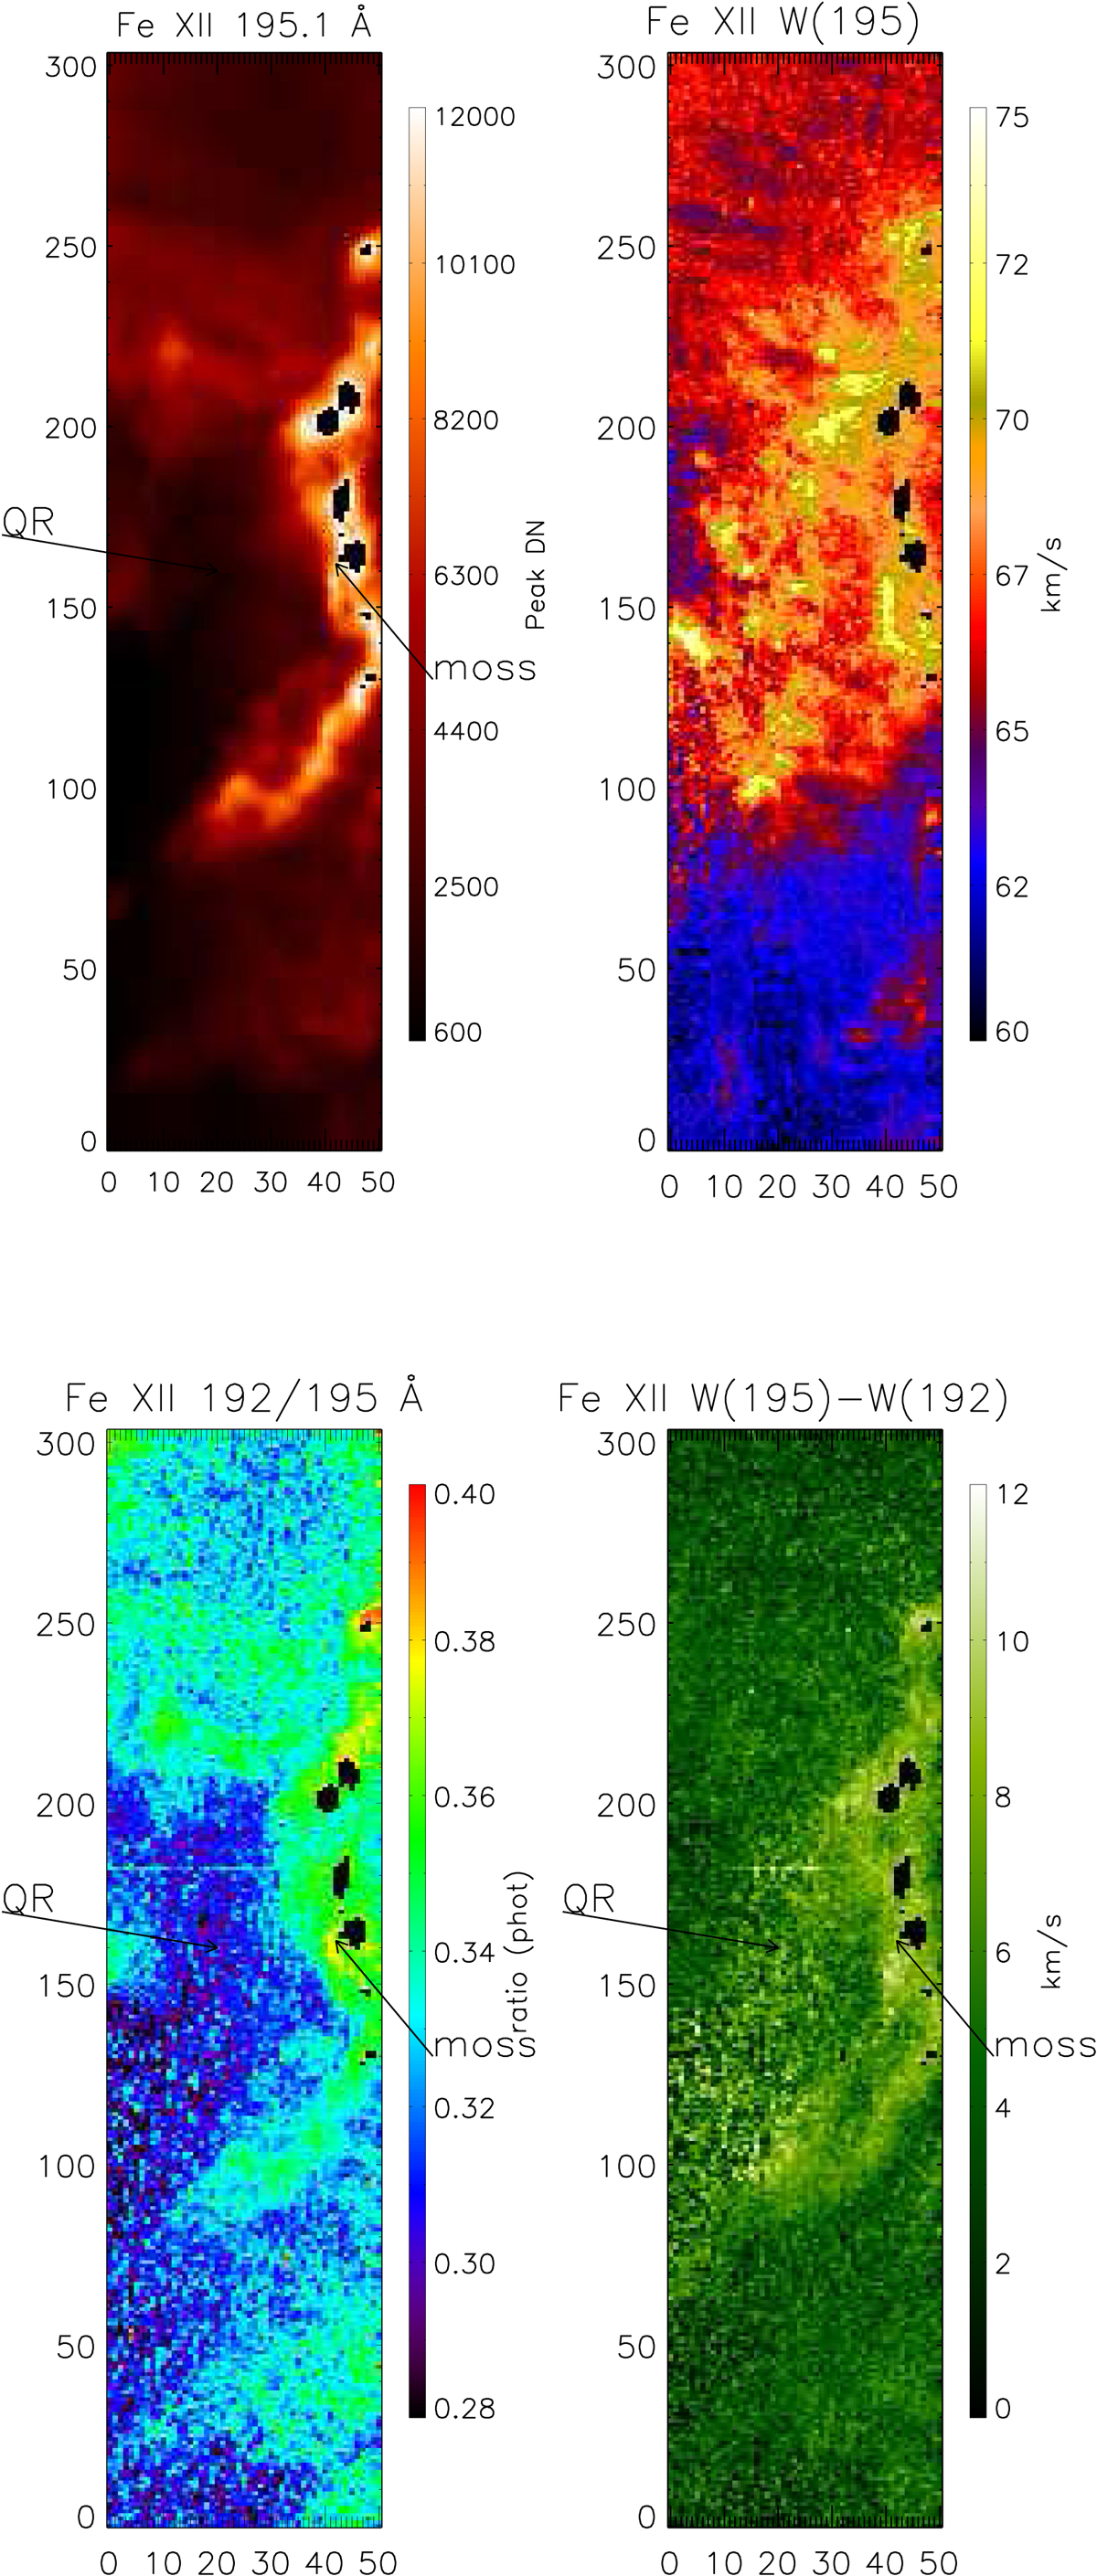
Top: peak intensity (DN) and FWHM (km s−1) of the 195 Å line, with pixels above 12 000 blanked. Bottom: 192/195 Å intensity ratio (phot), and difference between the FWHM of the 195 and 192 Å lines (km s−1). Two regions selected for further analysis, on a moss and a quiet region (QR) within the active region are shown.
Current usage metrics show cumulative count of Article Views (full-text article views including HTML views, PDF and ePub downloads, according to the available data) and Abstracts Views on Vision4Press platform.
Data correspond to usage on the plateform after 2015. The current usage metrics is available 48-96 hours after online publication and is updated daily on week days.
Initial download of the metrics may take a while.