Fig. 12.
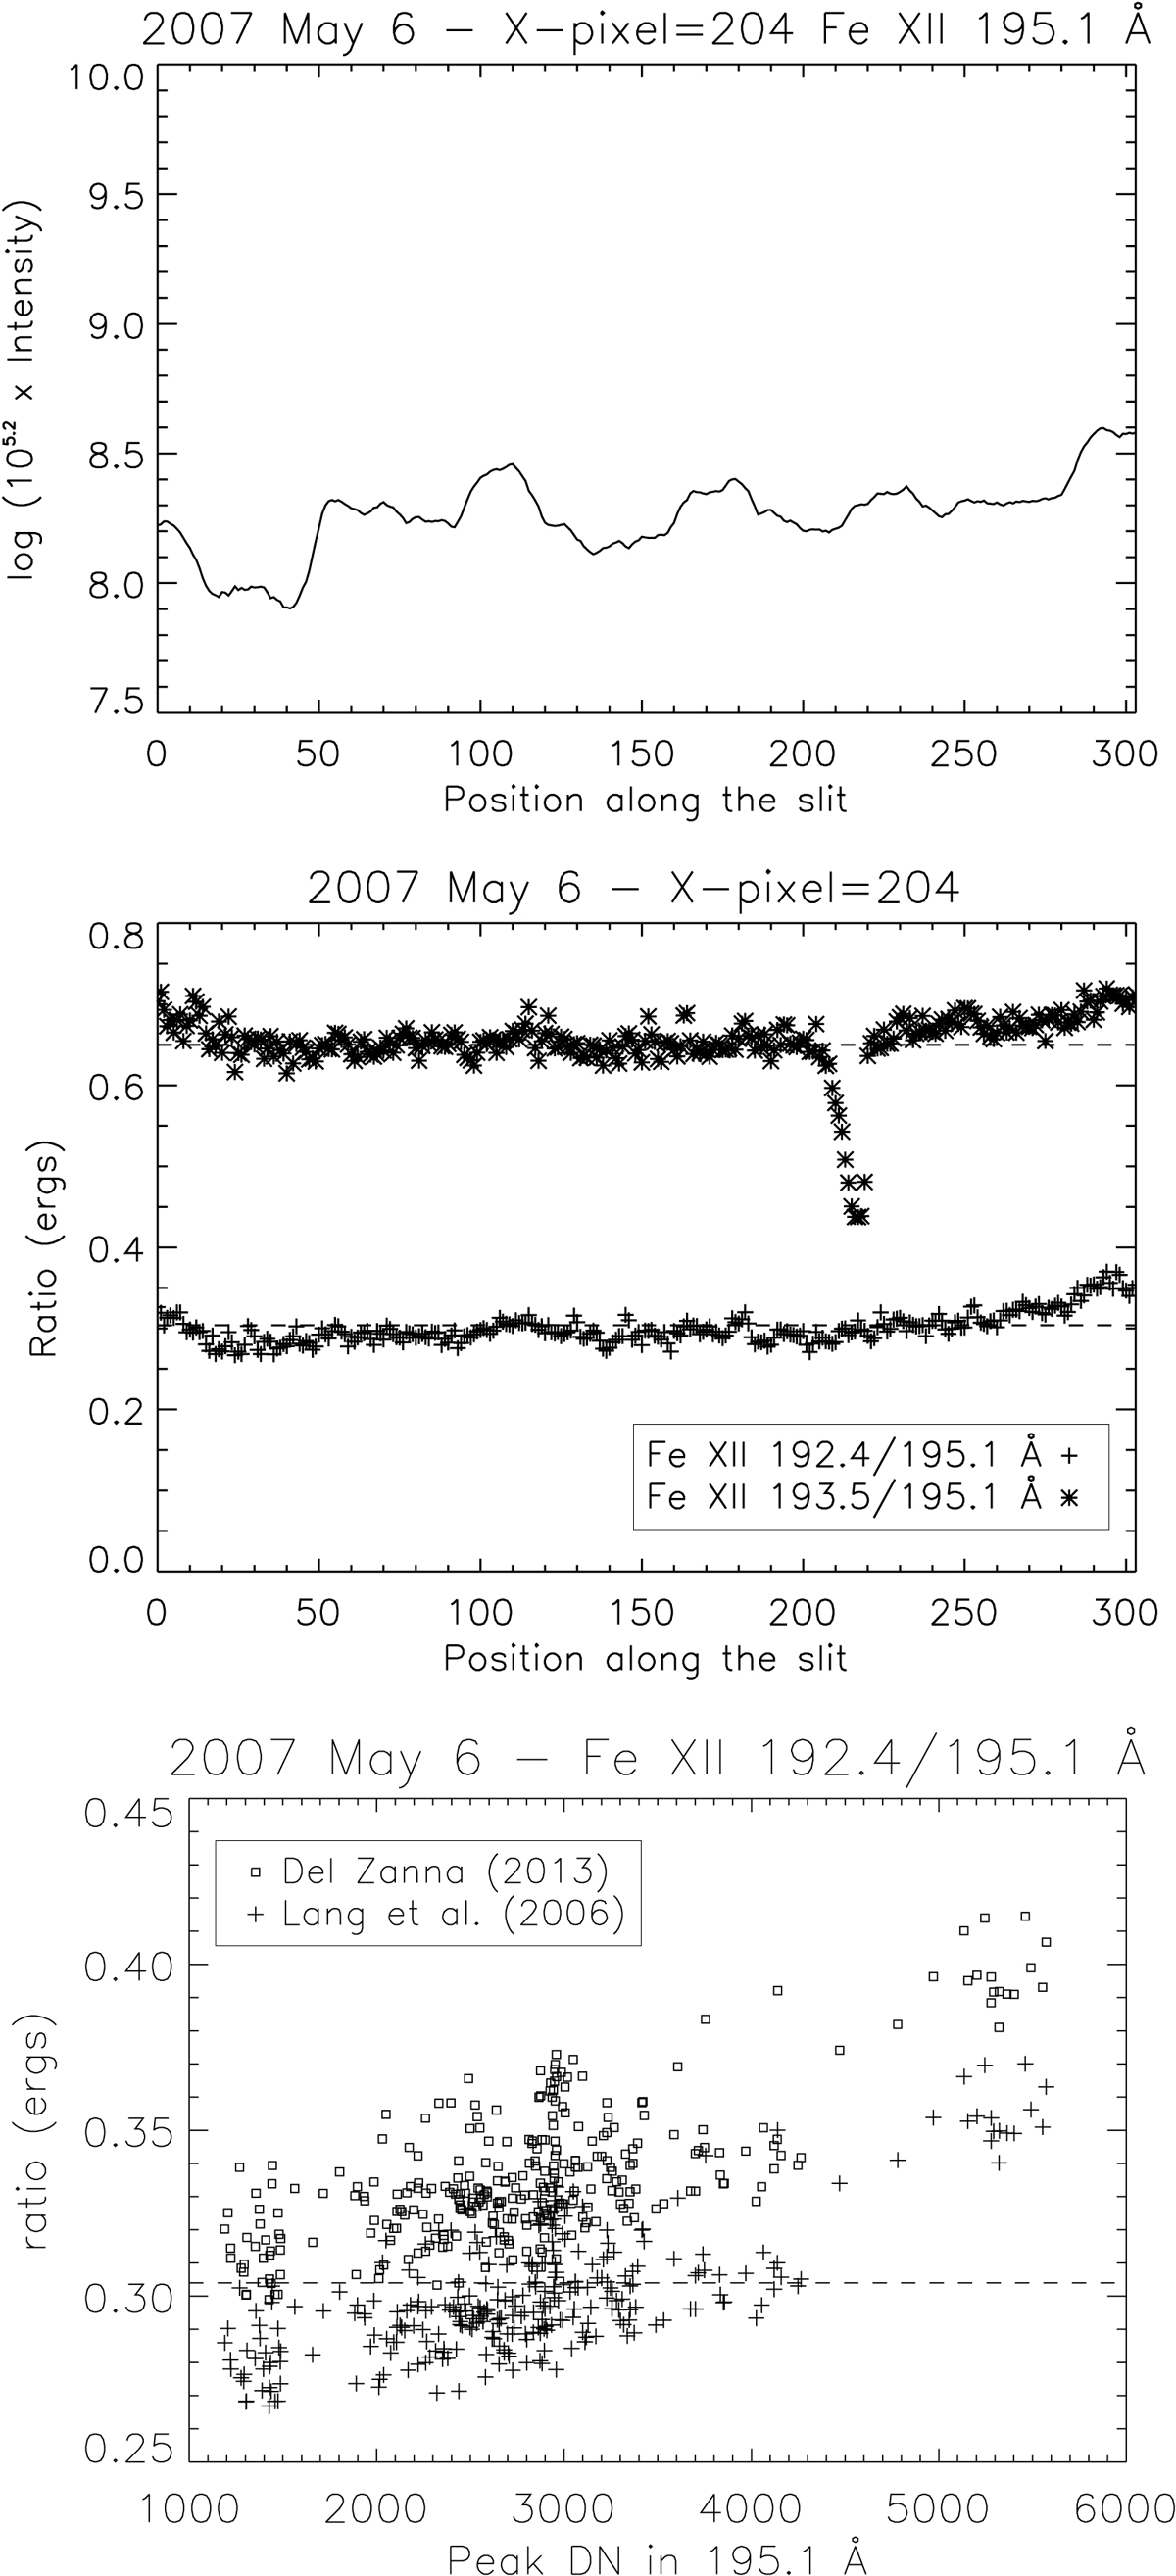
Top: logarithmically-scaled intensity of the Fe XII 195 Å line along 304″ of the 1″ slit, across AR loops observed on 2007 May 6, as in Fig. 12 of Young et al. (2009). Middle: intensity ratios of the Fe XII lines, using the ground calibration. Bottom: intensity ratio of the Fe XII 192 versus 195 Å lines as a function of the peak intensity in the stronger line, and for two different radiometric calibrations.
Current usage metrics show cumulative count of Article Views (full-text article views including HTML views, PDF and ePub downloads, according to the available data) and Abstracts Views on Vision4Press platform.
Data correspond to usage on the plateform after 2015. The current usage metrics is available 48-96 hours after online publication and is updated daily on week days.
Initial download of the metrics may take a while.