Fig. 1.
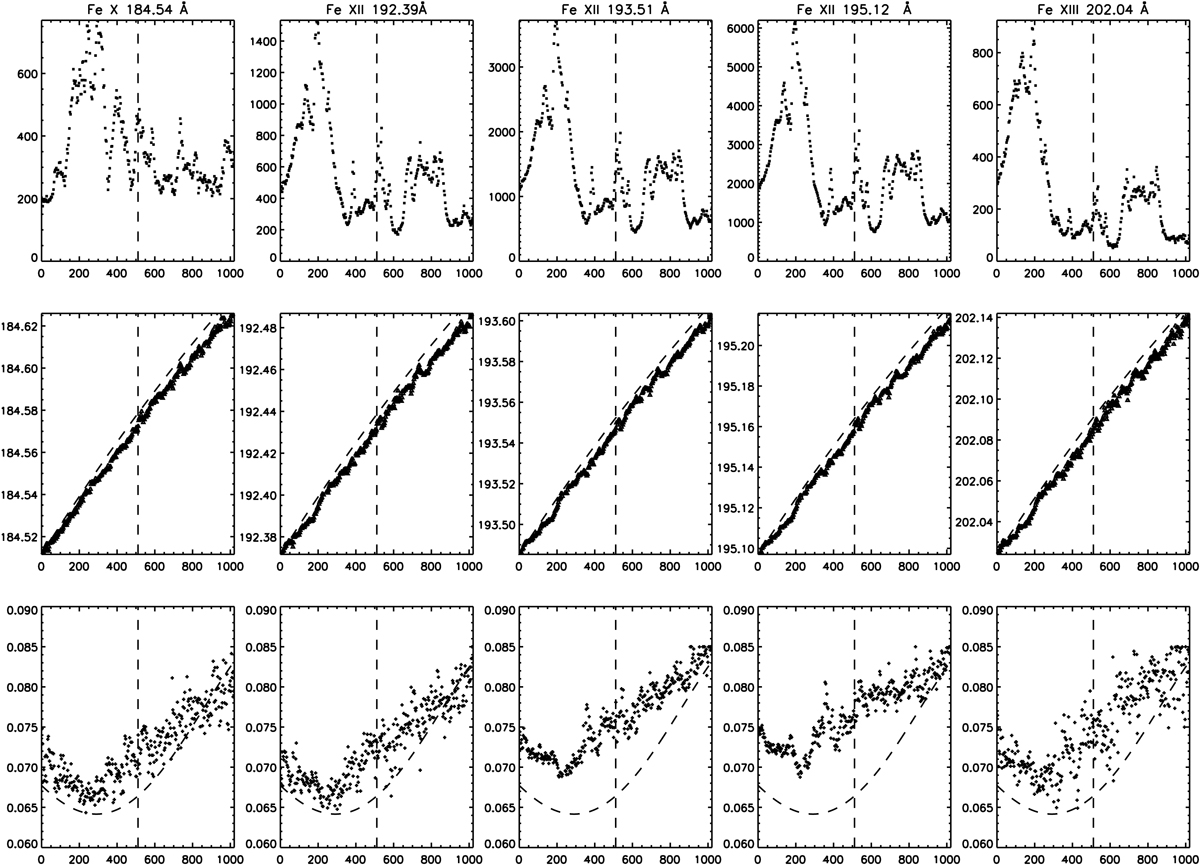
Top row: peak DN in a selection of SW lines, as function of slit position, for 160 s exposure with 2″ slit on the quiet Sun, recorded on 2006-10-28. The dashed vertical line indicates the mid position of the 1024 slit. Middle row: line centroid positions (Å); the dashed line indicates the estimated variation as available in the EIS software notes. Bottom row: FWHM (Å) in the lines, while the dashed line indicates the estimated variation as available in the EIS software notes. The bottom axis is the position along the slit, from bottom (pixel 0) to the top (pixel 1023).
Current usage metrics show cumulative count of Article Views (full-text article views including HTML views, PDF and ePub downloads, according to the available data) and Abstracts Views on Vision4Press platform.
Data correspond to usage on the plateform after 2015. The current usage metrics is available 48-96 hours after online publication and is updated daily on week days.
Initial download of the metrics may take a while.