Fig. A.18
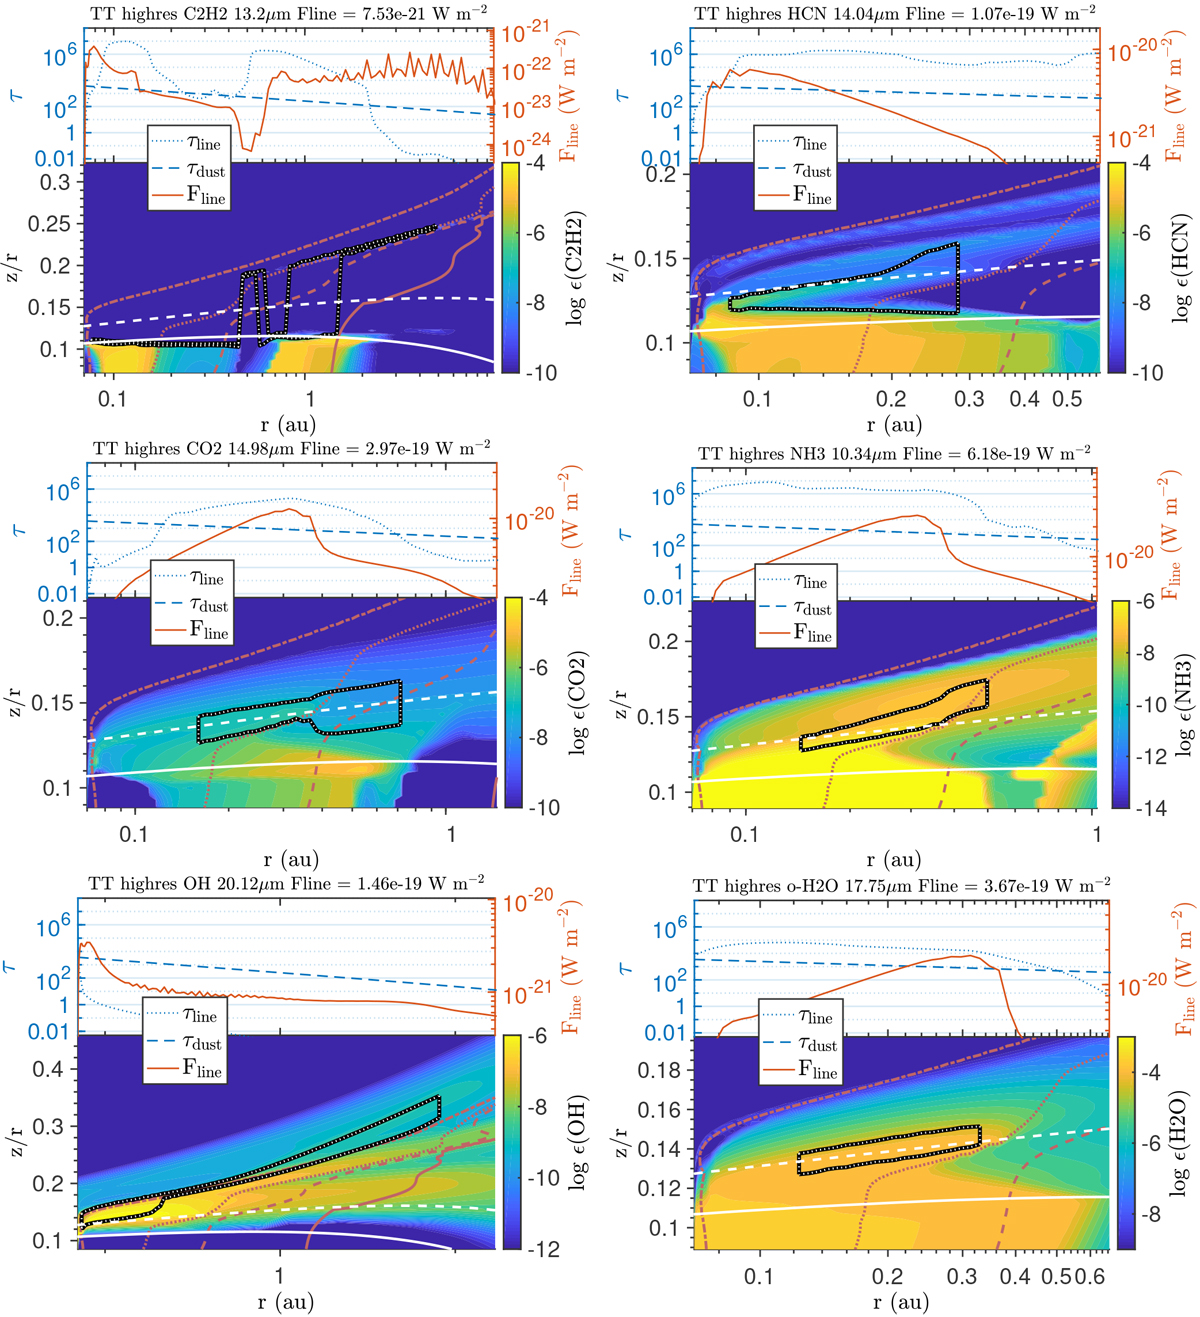
Line-emitting regions for the model TT highres for C2H2, HCN, CO2, NH3, OH, and o-H2O. On the upper panel, the 20 μm dust continuum and gas line optical depths and the line flux are plotted. The optical depths and line fluxes are calculated using the vertical escape probability. On the lower panel, the plotted colour map is the molecular abundance (relative to the total elemental hydrogen abundance, across all species), with contour increments every 0.5 dex. The over-plotted contours are the main line-emitting area (black-and-white line), the visual extinction (dashed white line at AV = 1, and solid white line at AV = 1), and gas temperature. The gas temperature is plotted in red at 100, 200, 300, and 1000 K (solid, dashed, dotted, and dash-dotted lines respectively).
Current usage metrics show cumulative count of Article Views (full-text article views including HTML views, PDF and ePub downloads, according to the available data) and Abstracts Views on Vision4Press platform.
Data correspond to usage on the plateform after 2015. The current usage metrics is available 48-96 hours after online publication and is updated daily on week days.
Initial download of the metrics may take a while.