Fig. 2
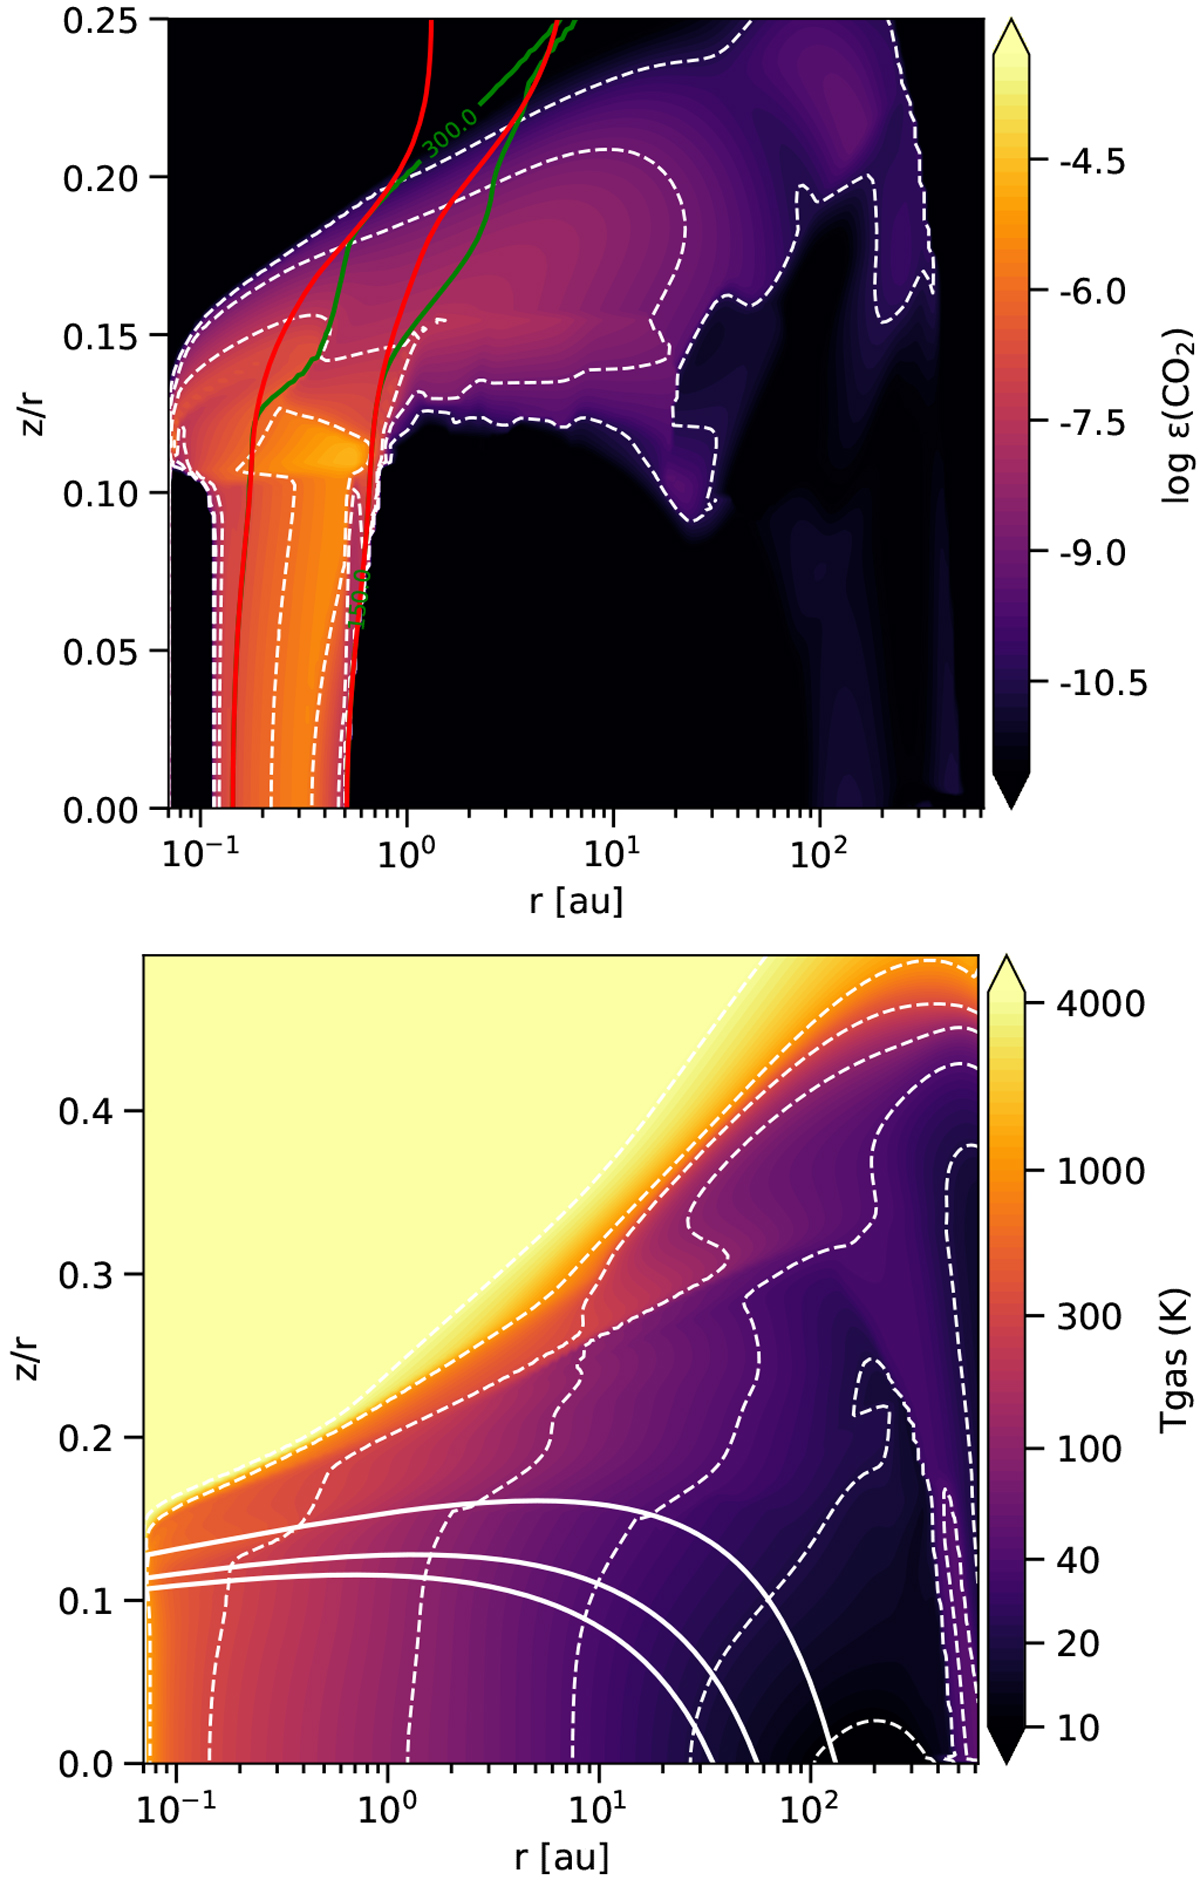
Top panel: CO2 abundance (relative to hydrogen) of the standard T Tauri model. The white dashed contour lines trace the CO2 abundance at the levels labelled on the colour-bar, the solid green contour lines trace where Tgas = 150 and 300 K, while the redlines trace where Tdust = 150 and 300 K. Bottom panel: gas temperature of the same model. The thick, solid white contour lines indicate the level of visual extinction, at AV = 1, 5, and 10. The dashed contour lines correspond to the temperature labels on the colour bar (i.e. they are at 10, 20, 40 K, and so on).
Current usage metrics show cumulative count of Article Views (full-text article views including HTML views, PDF and ePub downloads, according to the available data) and Abstracts Views on Vision4Press platform.
Data correspond to usage on the plateform after 2015. The current usage metrics is available 48-96 hours after online publication and is updated daily on week days.
Initial download of the metrics may take a while.