Fig. A.6
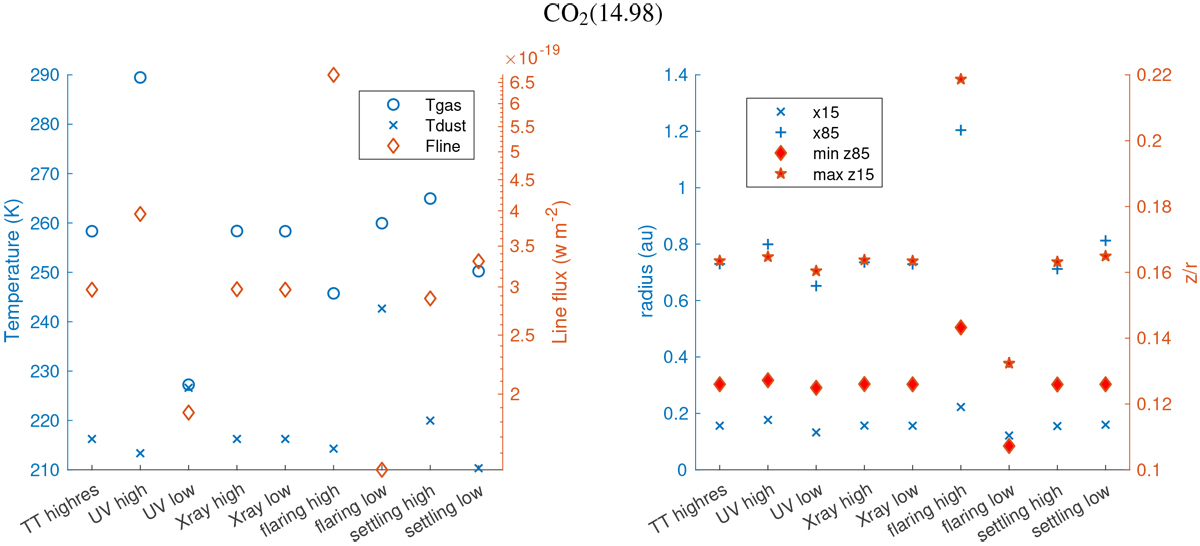
Properties of the line-emitting area of the CO2 line at 14.98299 μm, calculated using the escape probability method for our series of models with a gas-to-dust ratio of 100: 1. Left-hand panel: average gas and dust temperatures, weighted by the mass of each grid point (left-hand y-axis), and the difference between them (on the right-hand y-axis). Right-hand panel: inner (“x15”) and outer (“x85”) radial boundaries of the line-emitting region (on the left-hand y-axis), and the vertical boundaries of the line-emitting region (on the right-hand y-axis). If the line-emitting region is shaped like a box, as in Fig. 3, then “min z85” is the lower-left corner, and “max z15” isthe upper-right corner.
Current usage metrics show cumulative count of Article Views (full-text article views including HTML views, PDF and ePub downloads, according to the available data) and Abstracts Views on Vision4Press platform.
Data correspond to usage on the plateform after 2015. The current usage metrics is available 48-96 hours after online publication and is updated daily on week days.
Initial download of the metrics may take a while.