Fig. 1
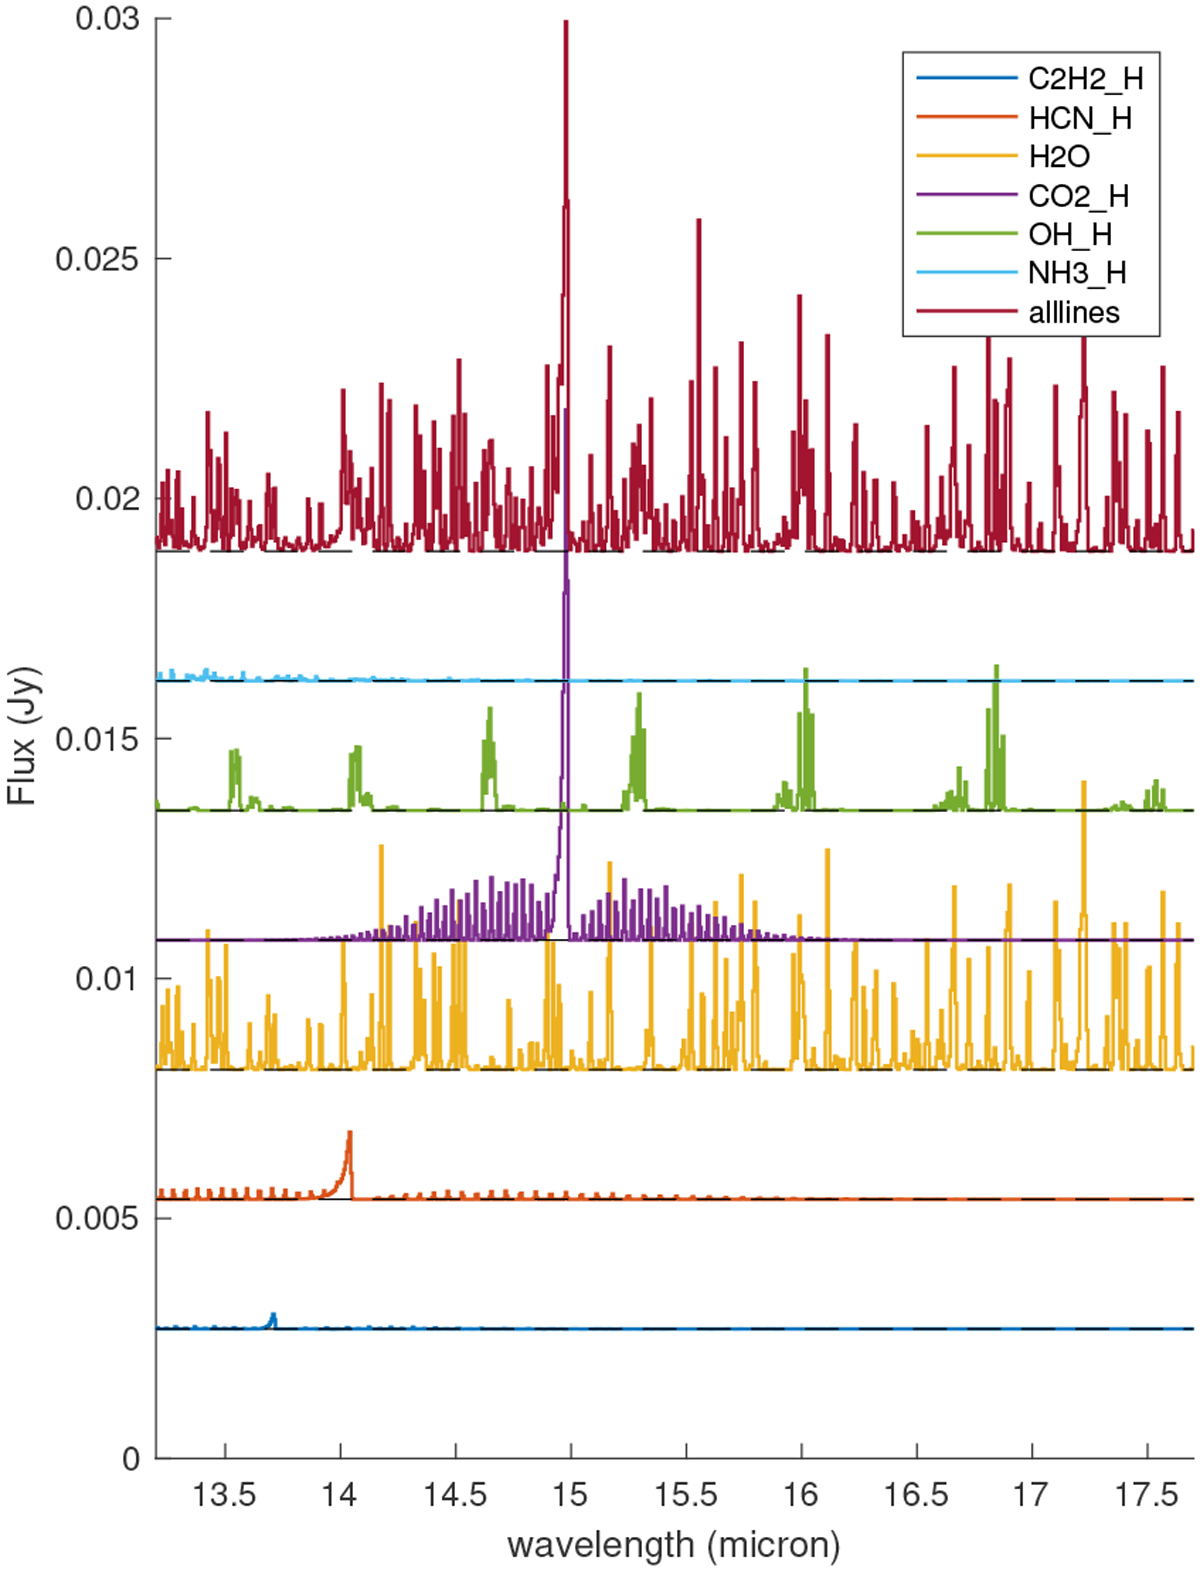
FLiTs spectra of the standard T Tauri disk model, at a spectral resolution of R = 2800. Each individual spectrum has been vertically offset by an arbitrary amount (the continuum levels ofeach spectrum are indicated by horizontal dashed lines). The top spectrum “alllines” includes all of the other plotted species together, as well as many other species such as CH4 and Fe which do not greatly affect the spectra seen here and can – until better observatories such as JWST might detect them – be disregarded. The “_H” in the legend refers to the fact that the ro-vibrational spectroscopic data are taken from the HITRAN database.
Current usage metrics show cumulative count of Article Views (full-text article views including HTML views, PDF and ePub downloads, according to the available data) and Abstracts Views on Vision4Press platform.
Data correspond to usage on the plateform after 2015. The current usage metrics is available 48-96 hours after online publication and is updated daily on week days.
Initial download of the metrics may take a while.