Fig. 5.
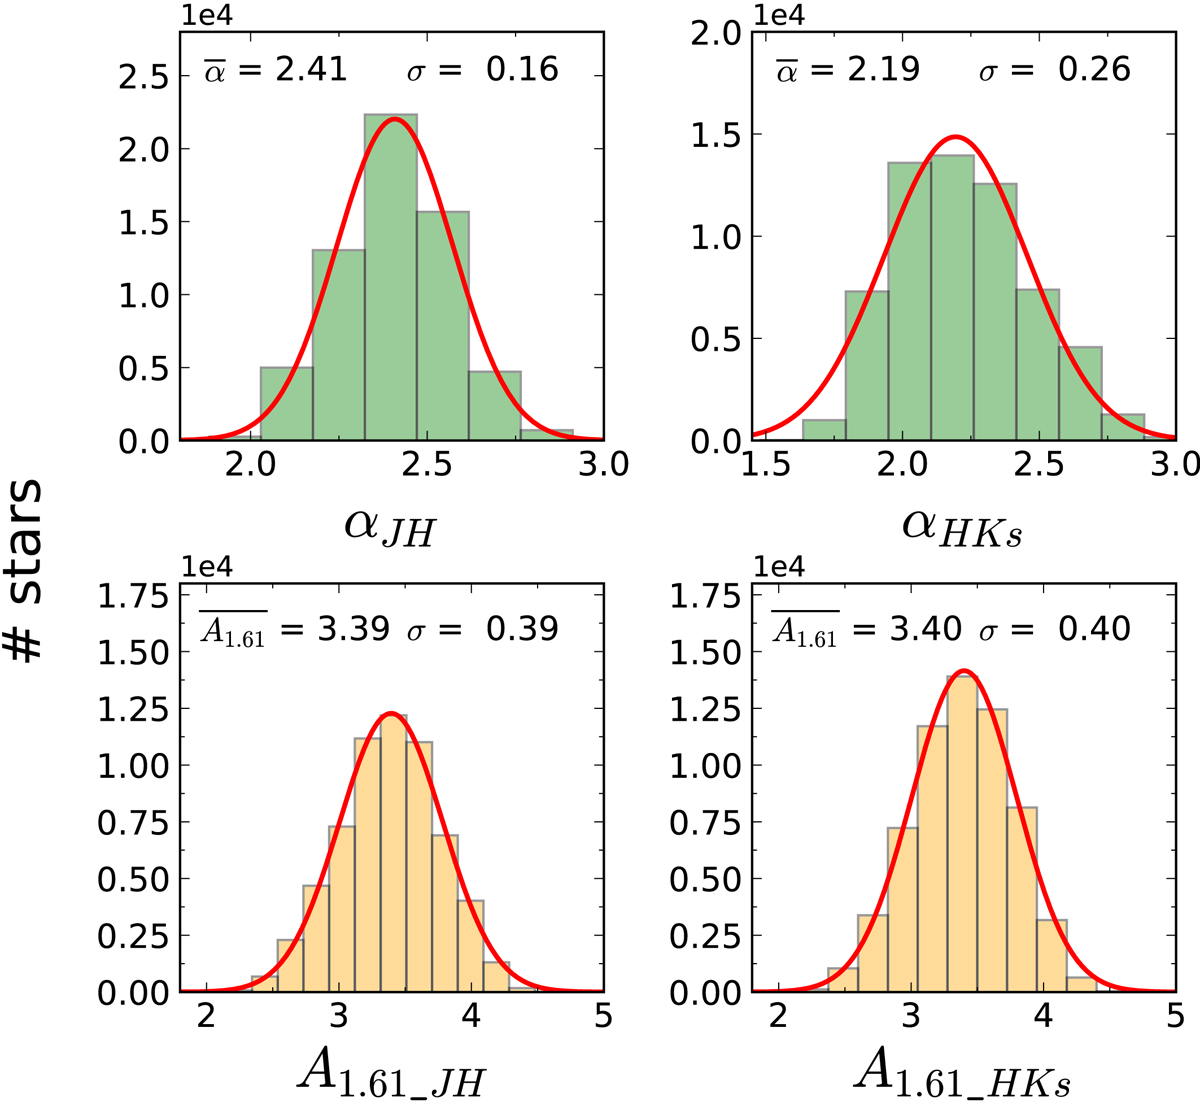
Upper panels: histograms obtained for αJH (left panel) and αHKs (right panel) using the method presented in Sect. 4.1. Lower panels: histograms obtained for A1.61, associated with the calculations using JH and HKs. The red lines show the Gaussian fits to the data. The mean and the standard deviation of each histogram are specified in each panel.
Current usage metrics show cumulative count of Article Views (full-text article views including HTML views, PDF and ePub downloads, according to the available data) and Abstracts Views on Vision4Press platform.
Data correspond to usage on the plateform after 2015. The current usage metrics is available 48-96 hours after online publication and is updated daily on week days.
Initial download of the metrics may take a while.