Fig. 1.
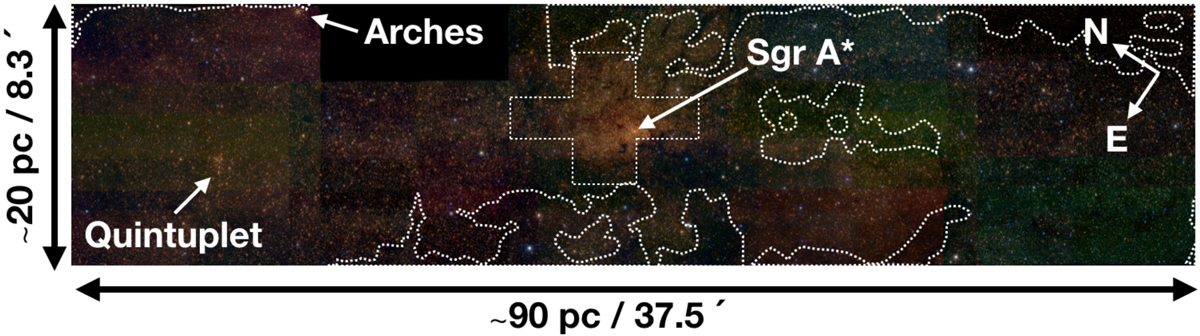
Image of the studied region produced combining the Ks, H, and J bands in red, green, and blue, respectively. Sagittarius A* and the Arches and Quintuplet clusters are indicated by arrows. The black rectangle near the Arches cluster corresponds to a field with incomplete data. The white dashed contours indicate regions dominated by dark clouds. The cross-shaped region corresponds to a low completeness region due to crowding (the nuclear star cluster, NSC).
Current usage metrics show cumulative count of Article Views (full-text article views including HTML views, PDF and ePub downloads, according to the available data) and Abstracts Views on Vision4Press platform.
Data correspond to usage on the plateform after 2015. The current usage metrics is available 48-96 hours after online publication and is updated daily on week days.
Initial download of the metrics may take a while.