| Issue |
A&A
Volume 630, October 2019
|
|
|---|---|---|
| Article Number | A132 | |
| Number of page(s) | 13 | |
| Section | Stellar structure and evolution | |
| DOI | https://doi.org/10.1051/0004-6361/201936101 | |
| Published online | 04 October 2019 | |
The origin of R CrA variability
A complex triple system hosting a disk
1
INAF-Osservatorio Astronomico di Padova, Vicolo dell’Osservatorio 5, 35122 Padova, Italy
e-mail: This email address is being protected from spambots. You need JavaScript enabled to view it.
,This email address is being protected from spambots. You need JavaScript enabled to view it.
2
INAF-Osservatorio Astronomico di Capodimonte, Salita Moiariello 16, 80131 Napoli, Italy
3
INAF-Osservatorio Astrofisico di Catania, Via S.Sofia 78, 95123 Catania, Italy
Received:
14
June
2019
Accepted:
1
August
2019
Abstract
Context. R CrA is the brightest member of the Coronet star-forming region and is the closest Herbig AeBe star with a spectrum dominated by emission lines. Its luminosity has been monitored since the end of the nineteenth century, but the origin of its variability, which shows a stable period of 65.767 ± 0.007 days, is still unknown.
Aims. We studied photometric and spectroscopic data for this star to investigate the nature of the variability of R CrA.
Methods. We exploited the fact that the near-infrared luminosity of the Herbig AeBe stars is roughly proportional to the total luminosity of the stars to derive the absorption, and then mass and age of R CrA. In addition, we modeled the periodic modulation of the light curve as due to partial attenuation of a central binary by a circumbinary disk. This model reproduces the observations very well.
Results. We found that the central object in R CrA is a very young (1.5 ± 1.5 Myr) highly absorbed (AV = 5.47 ± 0.4 mag) binary; we obtain masses of MA = 3.02 ± 0.43 M⊙ and MB = 2.32 ± 0.35 M⊙ for the two components. We propose that the secular decrease of the apparent luminosity of R CrA is due to a progressive increase of the disk absorption. This might be related to precession of a slightly inclined disk caused by the recently discovered M-dwarf companion. This means that R CrA might be a triple system hosting a disk.
Key words: stars: pre-main sequence / circumstellar matter / accretion / accretion disks / protoplanetary disks / planets and satellites: formation
© ESO 2019
1. Introduction
Exoplanets form within protoplanetary disks around young stars (see, e.g., Chen et al. 2012; Marshall et al. 2014). Observations suggest that giant planets form more frequently around intermediate-mass stars than around solar-mass stars (see, e.g., Johnson et al. 2010; Nielsen et al. 2019). Herbig AeBe (HAeBe) stars (Herbig 1960; Hillenbrand et al. 1992) are still embedded in gas-dust envelopes and are frequently surrounded by circumstellar disks (Perez & Grady 1997). They are young (< 10 Myr), of intermediate mass (1.5–8 M⊙), typically have spectral type A and B (sometime F), and show strong Balmer emission lines in their spectra. They are characterized by a strong infrared excess (The 1994) that is due to a warm circumstellar disk, and represent the more massive counterparts of T Tauri stars. They are experiencing accretion, and their spectral line profiles are very complex. Moreover, a quite consistent number of Herbig Ae/Be are strongly variable stars (Vioque et al. 2018), with typical periods from days to weeks (Eiroa et al. 2002; Oudmaijer et al. 2001) and amplitudes of several magnitudes in the optical.
The Coronae Australis (CrA) molecular cloud complex is one of the nearest regions with ongoing star formation (distance ∼130 pc, Neuhäuser & Forbrich 2008). In its center lies the Coronet cluster, which is characterized by a very high and variable extinction (AV up to 45 mag). R CrA (HIP93449) is a HAeBe star, and it was the first variable star to be identified in the CrA molecular cloud. Its spectral type is highly debated, and estimates vary from F5 (e.g., Hillenbrand et al. 1992) and A5 (e.g., Chen et al. 1997), to B5III peculiar (Gray et al. 2006)) and B8 (e.g., Bibo et al. 1992). R CrA is much brighter in the near-infrared (NIR; J = 6.94; H = 4.95; K = 3.46 mag, Ducati 2002; Cutri et al. 2003) than in the visual (V = 11.92 mag, Koen et al. 2010). Its brightness varies with time by up to four magnitudes, and its spectrum appears highly reddened. R CrA was observed as part of the SpHere INfrared survey for Exoplanets (SHINE) survey (Chauvin et al. 2017), the main GTO program of the Spectro-Polarimetric High-contrast Exoplanet REsearch (SPHERE) at the Very Large Telescope (VLT; Beuzit et al. 2019). The images acquired with SPHERE revealed a quite complex system, which includes a previously unknown M-dwarf stellar companion (Mesa et al. 2019), together with a bright jet-like structure and the possible presence of a circumstellar disk outside the stellar companion.
Takami et al. (2003) proposed the presence of a stellar companion and of an outflow based on their spectroastrometric observations at the Anglo-Australian Telescope. They estimated a separation of 8 au and a period of ∼24 years for the binary. These values disagree with those obtained for the companion found in high-contrast imaging. The presence of a companion was also proposed by Forbrich et al. (2006) in order to explain the X-ray spectrum of R CrA because strong X-ray emission is not expected from HAeBe stars.
R CrA has been monitored by several photometric campaigns for more than 120 years. Bellingham & Rossano (1980) detected long-period optical variation, and Herbst & Shevchenko (1999) found a variability of several tenths of magnitudes, but no period shorter than 30 days in the Maidanak Observatory data. A period of 66 days was reported based on American Association of Variable Stars Observers (AAVSO) data by Percy et al. (2010).
The main goal of this paper is to investigate the origin of the variability of R CrA by combining archive photometric and spectroscopic data. Because the fundamental physical quantities of the star derived in the literature are somewhat controversial and because these quantities are crucial for our study, we first derive them using a new method and the analysis of part of the spectral energy distribution (SED). The method is assessed using the photometric and spectroscopic data of a homogeneous sample of well-studied HAeBe stars. In the following analysis we start analyzing the photometry of Herbig Ae/Be stars (Sect. 2) by setting the context. With the purpose of studying the R CrA variability, we then use several archival data and proprietary data of the Rapid Eye Mount (REM) telescope. These are presented in Sect. 3, and light curves are extracted in Sect. 4. A model that matches observational data well is described in Sect. 5. In Sect. 6 we combine these photometric data with spectroscopic data from directory discretionary time (DDT) observations obtained with the diffraction limited integral field spectrograph SINFONI at the ESO VLT telescope in 2018 (Mesa et al. 2019). Conclusions are drawn in Sect. 7.
2. SED and stellar parameters
The SED of HAeBe stars, in particular that of R CrA, is very complex because different components contribute to the total emission, and their relative weight varies at different wavelengths. The UV-NIR portion of the spectrum alone shows four main components (Merín et al. 2004; Meijer et al. 2008):
-
The photospheric emission, possibly reddened by the absorption of circumstellar and interstellar dust; this is expected to dominate at optical wavelengths.
-
A hot spot on the stellar surface corresponding to the shock in the accretion region; this is expected to dominate in the UV.
-
The warmer part of the disk, dominating in the near IR (above 2 μm), possibly with some contribution by the cool part of the disk in the thermal IR. Dust absorption is weak in this spectral region.
-
Some light might be reflected by the circumstellar matter; this is essentially a scaled photospheric spectrum.
Above 2 μm, we expect that the emission from the warmest part of the disk is dominant. In the case of R CrA, this is shown not only by the shape of the SED, but also by the interferometric observation obtained with the instrument AMBER at the Very Large Telescope Interferometer (VLTI/AMBER; Kraus et al. 2009). This resolved the source into two Gaussians with FWHMs of about 25 mas (4 au) and 5.8 mas (0.9 au). The second Gaussian provides about two-thirds of the total flux in the K band. The prevalence of the disk emission in the NIR was later confirmed by Lazareff et al. (2017) using PIONEER observations. In general, if the disk extends inward up to the sublimation limit of the dust (see also Lazareff et al. 2017), it reaches temperatures in the range 1500–1800 K regardless of the emission of the central source. This is not possible if a companion at a distances of the order of an au breaks the disk at short separation, for instance. Lazareff et al. (2017) estimated a dust sublimation temperature of 1650 K based on the analysis of the SED of several HAeBe stars. They also argued that this is consistent with an inner rim temperature of 1800 K. However, they also noted that the disk should have a range of temperatures. We here adopt a critical temperature of 1500 K; we considered longer wavelengths than they did, with a stronger contribution by regions at lower temperatures. In agreement with Lazareff et al. (2017), this implies a close similarity between the SED of the inner part of the disk among different objects: The emission of this region of the disk is expected to be roughly proportional to the luminosity of the star if the disk flaring is not too different from star to star. In turn, the luminosity is expected be proportional to the fourth power of the temperature as long as the stellar radius does not change too much among HAeBe stars. We show that even if these assumptions appear very approximate, they allow constraining the temperature and other characteristics of the stars.
We therefore assume that the absolute luminosity in the WISE W2 band (central wavelength 4.6 μm, passband width of 1.1 μm) is a good proxy for the total luminosity for most of the HAeBe stars. If this is true, we may assume that the thickness of the disk, and then the fraction of stellar light that is intercepted by the dust and is reprocessed into thermal radiation, is the same for all the stars. For cases where absorption is negligible (not a correct assumption in general), the V − W2 color directly yields an estimate of the correction to the W2 absolute magnitude that is required to obtain the absolute magnitude of the star. In this way, we can obtain the luminosity of the star from the V magnitude and the stellar mass by comparison with pre-main-sequence isochrones, given a suitable temperature. If the temperature is also known, for instance from the spectral type, then age and stellar mass can be derived immediately.
The most critical step in this process is deriving the correction to the W2 absolute magnitude that is required to obtain the absolute magnitude of the star. This is not an easy task for individual stars, especially in the presence of absorption, as in the case of R CrA, where we used the typical NIR-IR SED for an HAeBe star. We first selected a sample of these stars and applied this analysis to all of them. We then searched for those with the lowest absorption, that is, stars with the lowest value of the V − W2 color whose disk is likely to be seen face on to extract the proper correction to the W2 magnitude. We excluded cases that do not have a warm disk at all.
We used two compilations of HAeBe stars: the extensive compilation by Vioque et al. (2018), which does not include R CrA, however, and a more limited sample by Hamann & Persson (1992) that does include R CrA (see Table 1). The parallaxes for the stars are taken from Gaia DR2 (Gaia Collaboration 2018), except for R CrA itself, for which we adopted the parallax estimated in Mesa et al. (2019)1. The V magnitude is taken from the SIMBAD catalog, the J magnitude from 2MASS (Skrutskie et al. 2006), and the W2 one from the WISE catalog (Cutri et al. 2013). With this approach we find that MV = MW2 + 4.45 for the stars at the lower envelope of the distribution (solid line in Fig. 1). When the zero-points of V and W2 photometry are considered, the warm disk reconverts a fraction equal to 0.17 of the total energy emitted by the star in thermal emission. When we assume that the disk has an albedo equal to zero, this corresponds to an optically thick inner disk up to an effective angle of ±9.5° from the disk equator (this angle corresponds to a sky area equal to 17% of the total). This value approximately agrees with the value that is typically expected for inner disks around HAeBe stars from interferometric measures (Lazareff et al. 2017). It is worth noting that in the case of accreting T Tauri stars, the typical disk-to-stellar luminosity ratio (Ldisk/Lstar), drawn from their SED by combining optical, 2MASS, and Spitzer data, is ∼20%–30% (see histograms in Fig. 14 of Merín et al. 2008 and Fig. 12 of Alcalá et al. 2008). Using data provided in those works, we indeed found a strong linear correlation between Ldisk and Lstar, and we confirm that Ldisk/Lstar ≈ 0.25. This correlation may be partly attributed to reprocessing of the stellar light by the dusty disk, but also to the correlation between stellar luminosity, and hence stellar mass, with the accretion luminosity (see Alcalá et al. 2017). A similar correlation for HAeBe stars is therefore expected. Kenyon & Hartmann (1987) defined the regime of accreting disks as those with Ldisk/Lstar > 0.1, while for passive reprocessing disks, 0.02 < Ldisk/Lstar < 0.08. According to this classification, R CrA (which has Ldisk/Lstar = 0.17) has an accreting disk.
Basic data for Herbig Ae-Be stars in our sample.
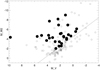 |
Fig. 1. Comparison between the absolute magnitude in the V band and in the W2 band for samples of Herbig Ae-Be stars from Hamann & Persson (1992) (filled circles) and Vioque et al. (2018) (open circles); neither of them are corrected for absorption. The solid line is the relation MV = MW2 + 4.45 that we assume to be representative of unreddened objects. |
After we determined the correction that is required to convert the W2 magnitude into the V magnitude, we considered the stars in the sample by Hamann & Persson (1992). We divided these stars into three groups according to their spectra: (1) the spectrum is dominated by emission lines, (2) intermediate cases, and (3) the spectrum is dominated by absorption lines. We excluded the two stars (HD 52721 and HD 53367) for which no NIR excess can be detected in the WISE photometry. The values of absolute V-band magnitude MVW2 estimated with this procedure are listed in Table 1.
We assessed our method by comparing these estimates of the stellar luminosity MVW2 with those obtained by a different approach where we used the apparent V magnitudes and corrected them for an estimate of the extinction (hereafter MV abs). This can be derived from a comparison of the observed colors with those expected for pre-main-sequence stars with the same effective temperature. To this purpose, we only used the portion of the SED that is dominated by the stellar photosphere: in practice, we selected the V − J color because the accretion contribution is large at wavelengths shorter than V, and we wished to have a wide enough spectral range for this purpose. The contribution of the disk in the J band is not at all negligible; this needs to be considered in the analysis. In our schematic model, where the temperature of the inner disk is fixed at 1500 K and the fraction of the stellar luminosity that is reprocessed through the disk is constant, the correction for the disk contribution only depends on the temperature of the star and is well represented by the following equation in the temperature range 6000 < Teff < 30 000 K:
 (1)
(1)
where dJ is indeed the contribution of the disk in the J band. This is derived by fitting data that were obtained by combining a hot blackbody (of variable temperature) that describes the photospheric spectrum with a cooler blackbody (with a temperature of 1500 K) that reprocesses 17% of the radiation. We considered here the stellar temperatures determined by Manoj & Bhatt (2005) and compared the observed colors with the relation by Pecaut & Mamajek (2013) for pre-main-sequence stars. We then converted the E(V − J) reddening values into AV values using the reddening law by Cardelli et al. (1989) with RV = 4.7. As discussed by Lazareff et al. (2017), this value of RV is in the high range of those found in the literature and probably is more appropriate for highly extincted HAeBe stars (Hernández et al. 2004), while lower values are found for HAeBe stars with low extinction (Montesinos et al. 2009; Fairlamb et al. 2015; Blondel & Djie 2006)2. We here study the first class of objects, which includes R CrA. For these objects the precise value of RV is more important.
Figure 2 compares the absolute luminosity obtained using these two different approaches for the stars listed in Table 1. The agreement is good; the Pearson linear correlation coefficients are r = 0.92, 0.98, and 0.63 for AV, age, and mass, respectively, which all are highly significant for this sample of 20 stars. In particular, the values we obtain for R CrA are MVW2 = −0.30 using the W2 approach and MV abs = 0.14 using the absorption approach. Averaging the two results and taking the bolometric correction using the table by Pecaut & Mamajek (2013) into account, we obtain an absolute luminosity of log L/L⊙ = 2.12.
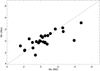 |
Fig. 2. Comparison between absolute magnitude MV obtained from W2 and from the correction for absorption for a sample of Herbig Ae-Be stars. The solid line represents equality between the two determinations. |
The most obvious outlier in this figure is R Mon, for which we derive a much higher luminosity from W2 photometry than from the extinction-correction method. In addition, KK Oph also appears discrepant. Because all these objects are variable and we used photometry that was taken at different epochs, some scatter in this comparison is expected. For instance, the V magnitude used for KK Oph (V = 10.99) is much brighter than other values listed in the literature (V = 12.36: Vioque et al. 2018; V = 11.45: Herbst & Shevchenko 1999). If we were to adopt the value of Vioque et al. (2018), the absolute visual magnitude would be MV = 0.74, which would agree better with the value obtained from the W2 photometry.
We compared this luminosity with that predicted by the pre-main-sequence models by the Pisa group (Tognelli et al. 2011); entering the temperature (from Manoj & Bhatt 2005), we then extracted an age and a mass for the stars. These values are listed in the last two columns of Table 1. In order to further assess the reliability of these determinations, in Fig. 3 we compare our absorption values in the V band, mass, and age with those listed by Vioque et al. (2018). The agreement is generally good (except for the ages of KK Oph and HD 97048) and supports the current estimates.
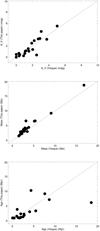 |
Fig. 3. Comparison between the values derived in this paper and those from Vioque et al. (2018). Upper left panel: absorption in the V band AV. Upper right panel: mass. Lower panel: age. The solid line represents identity. |
It is difficult to estimate the error bars because they are dominated by uncertainties in the methods rather than in the observable. We derive a reasonable guess by comparing the results obtained using different approaches. On average, differences are about 0.5 mag in AV, 15% in the masses, and 1.5 Myr in the ages. We adopted these values as error bars, which is a conservative approach. The values we obtain for R CrA are then 1.5 ± 1.5 Myr and M = 3.5 ± 0.5 M⊙ for the age and mass. We note that this approach assumes that R CrA is a single star; we show below that it is most likely a binary with two quite similar components, and we revisit these values accordingly. The absorption in the visual band (AV = 5.47 ± 0.5 mag) is slightly higher than the value obtained by Bibo et al. (1992) (AV = 4.65 mag).
R CrA belongs to the group of HAeBe stars whose spectra are dominated by emission lines. This group includes stars that are younger, more massive, and more absorbed on average. The median value is 1.5 Myr, with a root mean square (rms) scatter of individual values of 0.8 Myr; to be compared with 2.0 Myr, with an rms of 2.9 Myr, for the second group; and 3.2 Myr, with an rms of 3.3 Myr, for the third group). The median value for the mass is 3.7 M⊙, with an rms of 4.2 M⊙, with the second group at 3.0 M⊙, with an rms of 2.0 M⊙, and the third group at 2.7 M⊙, with an rms of 1.1 M⊙. The median value for the absorption is 4.0 mag, with an rms of 2.1 mag, with the second group at 1.4 mag, with an rms of 1.3 mag, and the third roup at 1.8 mag, with an rms of 1.0 mag. The ages and masses of these stars are not surprising: the strength of the emission lines is probably related to accretion, which is expected to decline with age and mass. The higher extinction might partly be attributed to a larger average distance. However, the correlation between distance and absorption shows a considerable scatter.
Of the stars whose spectra are dominated by absorption lines, R CrA is by far the nearest to the Sun. AB Aur and BS5999/V856 Sco are at a similar distance, but their spectrum is less extreme than that of R CrA, and these stars are older and less massive. R CrA is also very strongly absorbed, although there are more extreme cases in this respect in this sample. A summary of the properties of R CrA is given in Table 2.
Stellar parameters.
3. Photometric data
R CrA is a variable star, and the correct interpretation of the light curves at different wavelengths is crucial for understanding its nature. Table 3 lists a number of photometric data sets for R CrA. In the following, we give some details about them.
Summary of archival data.
3.1. AAVSO
The American Association of Variable Star Observers (AAVSO) is a community of amateur and professional astronomers that manages an archive of more than 34 million variable star observations. Percy et al. (2010) studied the photometric stability of R CrA by exploiting the 100-year-long sequence provided by AAVSO in the visible band, including about 10 000 measures and more than 1000 upper limits. They found a period of 66 days, stable in time but with slightly variable peak-to-peak photometric amplitude. They also found that the observed V magnitudes vary from 10.5 to 14.5.
3.2. MAO
A homogeneous photometric survey of R CrA was carried out at visible wavelengths at the Maidanak Observatory in Uzbekistan starting from 1983, and was published by Herbst & Shevchenko (1999).
3.3. ASAS
The All Sky Automated Survey (ASAS; Pojmanski 1997) is a project started in 1997 to monitor the luminosity of all stars brighter than 14 mag by exploiting two observing stations, one in Las Campanas Observatory, Chile (operating since 1997), and the other on Haleakala, Maui (operating since 2006). Both are equipped with two wide-field 200/2.8 instruments that simultaneously observe in V and I band. However, only V-band data are available in the online catalog. We found 1437 aperture photometry points for R CrA between 2001 and 2009.
3.4. ASAS-SN
The All-Sky Automated Survey for Supernovae (ASAS-SN; Shappee et al. 2014; Kochanek et al. 2017) currently consists of 24 small-diameter telescopes that are distributed around the globe and allow covering the whole visible sky every night. This survey provides 206 photometric points of R CrA in the visible that span from 2014 to 2018.
3.5. SuperWASP
The Wide Angle Search for Planets (WASP; Butters et al. 2010) uses two telescopes at Roque de los Muchachos (La Palma) and the South African Astronomical Observatory. Each telescope uses an array of eight 200 mm f1.8 Canon lenses feeding a 2k × 2k CCD. Data of R CrA cover the epochs from 2006 to 2008. These observations were acquired with a broadband filter covering a passband from 400 to 700 nm.
3.6. REM
We observed R CrA with the REM (Chincarini et al. 2003)AAVSO telescope located in La Silla. REM provides simultaneous photometry in the optical and NIR using the ROSS2 and REMIR instruments, observing in the g′, r′, i′, z′, and JHK band filters. The observations started in the night of August 7, 2018, and lasted until September 30, 2018, for a total of 23 points for each observing band. Observations allowed us to follow the photometric variation at seven different bands. The extension to the NIR is of particular relevance to study the variability of R CrA.
4. Light curve discussion
4.1. Secular evolution
The apparent magnitude of R CrA evolved significantly in the past century. Figure 4 shows the secular evolution of the magnitude of R CrA in the visual band since 1890, obtained using AAVSO photometry. We plot the median for each year. R CrA had a magnitude of ∼10 before 1915; it then declined by about two magnitudes between 1915 and 1920, and then oscillated between magnitude 12 and 13. This secular variation might either be an indication of a decrease in the accretion rate or of a variation in the dust absorption. We return on this point in Sect. 5. In addition to this secular evolution, R CrA shows short-term variability. In the following part of this section, the annual median magnitude was subtracted from each photometric point in order to discuss the variability on shorter timescales.
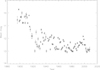 |
Fig. 4. Secular variation of AVVSO photometric measurements. Median values for each year are shown. |
4.2. Periods and phased curves
As shown by several authors (see, e.g., Bellingham & Rossano 1980; Percy et al. 2010), most of the short-term variability of R CrA can be described as a periodic behavior. Figure 5 shows the Lomb–Scargle periodogram (GLSP; Zechmeister & Kürster 2009) of the AAVSO data (from which we removed the secular trend, as discussed above). The peak of this diagram is for a period of 65.767 ± 0.007 days, in agreement with the previous estimate by Percy et al. (2010). The other relevant peaks correspond to the first and second harmonics of this period and aliases at one year of the fundamental mode together with the two first harmonics. The relative power of the harmonics shows that the shape of the light curve is not reproduced by a single sine wave.
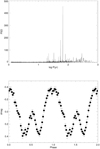 |
Fig. 5. Top panel: generalized Lomb–Scargle periodogram for the whole series of AAVSO photometric data for R CrA after subtracting the median for each year. Bottom panel: light curve phased at the peak of the periodogram (65.767 days). Points are the average for each phase bin, and error bars are the standard deviation of the mean. |
After we phased it at the best period derived from the GLSP, the shape of the light curve of R CrA is evident (see lower panel of Fig. 5). To reduce the impact of other sources of variations such as accretion and to exploit the rich photometric data series, we plot in this figure (and in the similar figures shown in the appendix) the mean values at each 0.02 phase bin, with the error bar given by the standard deviation of these mean values. The light curve is almost symmetric, with two maxima of unequal brightness. As shown in the appendix, a similar shape with only minor variations is also obtained by considering various subsets of the whole AAVSO data series (e.g., considering ten-year ranges) as well as all other photometric data series obtained at visible wavelengths. This light curve is then consistently found over about 120 years of observations. A similar regularity attributes its origin to some basic property of R CrA. Because the period appears to be long for stellar rotation, the most likely explanation is a binary orbital period (see Sect. 5).
4.3. Variation with color
The long wavelength coverage provided by the REM data allows a comparison of the light curves obtained in the visible and NIR. As for other Herbig AeBe stars, we expect that at short wavelengths (e.g., g′), luminosity is mainly due to accretion, while in the NIR (e.g., K band) it is mainly due to the hottest part of the circumstellar disk. At intermediate wavelengths (e.g., i′), we expect the contribution of the photosphere to be dominant. r′ can be influenced by emission in Hα. In addition, the wide spectral coverage of REM may help to model the (possibly variable) dust absorption by the disk itself, which is seen at an inclination of > 70° (see Mesa et al. 2019).
With the aperture photometry method we were able to trace the variability at all wavelengths for 80% of the phase, as shown in Fig. 6. In the bottom panel of Fig. 6 we compare the phased AAVSO sequence with the REM sequence, but zero-points of the magnitude were varied to allow a better visualization of the results. As expected, the light curve at optical wavelengths is indeed very similar to that found in AAVSO observations; the amplitude reduces progressively with wavelength in the NIR, with a very small variation (if any) in the K band.
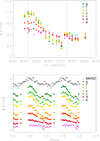 |
Fig. 6. Top: photometric variation of R CrA from REM images. Bottom: same as in the top panel, but phased to the 65.767-day period according to the AAVSO sequence (black). For better visualization, we applied an offset to the zero-point of each sequence. |
5. Modeling the light curve
Because the period is quite long, it is difficult to explain the light curve of R CrA as due to either rotation or pulsations in single star. The shape of the light curve is also different from that expected from mutual eclipses in a close binary system. The light curve of R CrA can probably be interpreted using a model where the star is a rather close binary, with a period equal to the fundamental period that can be extracted from the periodogram, and is surrounded by a circumbinary dusty disk. A similar scenario has been proposed to explain the variability of a class of extreme asymptotic giant branch (AGB) stars, the so-called RVb stars. Another case of partial attenuation by a circumbinary disk is that of the T Tauri star KH 15D (V582 Mon), see Aronow et al. (2018) and references therein3. This scenario itself is divided into two main alternatives, where the origin of the variation is related to variable extinction (see, e.g., the case of HR 4049 considered by Waelkens et al. 1991) or a variation of the light scattered by the disk (as proposed by Waelkens et al. 1996 for the case of the Red Rectangle). The wavelength dependence of the variability is crucial to distinguish between these two alternatives: if the amplitude of the light variation is fairly independent of wavelength, the contribution by the disk must be considered. Our REM data set indicates that the variability of R CrA is indeed very different in the optical and NIR: this supports the extinction scenario, which we adopt hereafter to explain the light curve at optical wavelengths. On the other hand, the contribution by the disk dominates in the NIR.
The RVb star model consists of two stars that are very different in the luminosity so that only the brightest component is observed. On the other hand, the light curve of R CrA has two maxima, each attributed to a different component; they have quite similar mass, with a luminosity ratio equal to the ratio between the luminosity of the primary and secondary peaks of the light curve.
In the RVb star scenario, the system is seen at an angle that is quite similar to the flaring angle of the disk, so that the star is strongly extincted by the disk when it is close to conjunction, and much less so when it is close to opposition. Within the R CrA scenario, the two components are then partially hidden by the disk during their motion around the common center of gravity, the extinction depending on their exact location along the orbit (see sketch in Fig. 7). We then constructed a model that describes the light curve considering that the stellar flux is due to two point-sources in Keplerian motion around a common center of gravity seen from a suitable angle, and that light from the two sources is behind an absorbing slab that has a variable extinction as a function of the height over the orbital mid-plane. Binary orbit and disk are here assumed to be coplanar. As mentioned above, the mass ratio between the two components can be obtained from the luminosity ratio between the two maxima using a reasonable mass–luminosity ratio: we found that this implies a mass ratio close to 0.77. We furthermore assumed that the disk extinction can be represented by a Gaussian functional form such as exp−(z/h0)2, where h0 represents half the disk thickness assuming that the absorbing slab is located at a distance from the common center of gravity equal to the binary semimajor axis. Within these assumptions, there is a degeneracy between the inclination of the disk and h0. To remove this degeneracy, we assumed that the system is seen at an inclination of 80°; while this is an arbitrary assumption, it allows a disk flaring angle as defined by h0 that is ∼15°. This value is quite reasonable for a circumstellar disk around a Herbig Ae-Be star. A lower inclination would imply a larger flaring angle. We note that a too large inclination angle (i > 86°) can be excluded by the absence of eclipses.
 |
Fig. 7. Schematic view of the extinction model for R CrA. The white and green ellipses represent the apparent orbits of the two components in the plane of the sky. The reddish region represents the area covered by the near side of the disk. When one of the two components is in this region, its light is attenuated by the dust in the disk. |
Within this model, the amplitude (and shape) of the light curve is very sensitive to the exact value we assume for h0, which is then accurately determined from observations. If h0 is very low, the light curve is characterized by a nearly constant value with only two unequal minima: this is because the system is seen at a moderate inclination, so that the disk hides each of the two stars only when they are close to conjunction. When the disk hides the stars even at quadrature, the light curve assumes the typical shape with two unequal maxima that we observe in the case of R CrA; but the depth of the minima in the light curve that occurs when both stars are close to quadrature increases rapidly with increasing h0. This curve is symmetric when we assume that the orbit is circular and that the disk extinction is independent of the azimuth angle.
We used our model to separately fit the light curves obtained at different epochs and from different sources (see the appendix). In the case of the AAVSO data, which extend over more than 100 years, we divided the data set into ten different groups that cover 20 years each (so that adjacent groups overlap). This allowed us to explore the variation with time of the light curve, if any. Results are listed in Table 4. In these computations, we assumed a period of P = 65.767 d and T0 (phase of principal maximum) at JD = 2413751.75. While most data sets are well fit by our simple model, which supports the assumption that the binary orbit is indeed circular, we note some offsets in the phases for the epochs between 1940 and 1980, with a first excursion to negative values (delays of the light curve with respect to expectation), followed by a similar excursion to positive values; a similar delay is obtained for the REM data set. These offsets do not imply clear asymmetries in the light curve, however: the difference of phase between principal and secondary maxima remains close to 0.5. The changes in the phase can be as large as 0.08, that is, about five days, which is much longer than the possible uncertainties in the observing epochs and of the variation of the light travel time due to the presence of the M-star companion found by Mesa et al. (2019)4. On the other hand, for the epochs around 2006 (i.e., the ASAS and SuperWasp data sets), the light curve does not look symmetric, with the second minimum at a phase later than 0.5. Of course, it is not possible to attribute similar oscillations to changes in the binary orbits. We instead attribute them to asymmetries in the disk. Variation in light curve phases during which the curve in general is still essentially symmetrical, as observed in the epochs between 1940 and 1980, can be attributed to warps in the outer parts of the disk that cause the principal and secondary maxima of the light curve to be delayed or to appear to soon with respect to the phases where the binary components are in opposition. On the other hand, an asymmetric light curve whose phases are offset between principal and secondary maxima different from 0.5 might be attributed to significant changes in the extinction that occurs in the inner regions of the disk, close to the binary.
Light-curve parameters derived at different epochs
Inspection of Table 4 also reveals that there is a systematic increase of h0 with time (see Fig. 8) that combines with the secular trend for the V magnitude (see Fig. 4). While the effect is not very strong, it seems that this secular increase of h0 is not simply linear, and that shorter term oscillations with two minima are overimposed, one around 1950 and the second around 2000. This trend might point to a secular increase of the disk thickness, but it may also be explained by a misalignment between the disk and stellar orbital planes and/or by a precession of the disk plane with respect to the orbital plane. The latter might be caused by the M-star companion found by Mesa et al. (2019) if the orbit of this last object is not coplanar with that of the close binary. While the period of the M-star companion is not well determined, it is likely of the order of 50–100 yr, and the orbit of the outer part of the disk around the primary is likely shorter than this. The secular variation of the disk extinction supports more a precession scenario rather than a simple misalignment between the disk and the orbital plane of the inner binary, while the shorter term oscillation could indeed be related to the orbital period of the M-star companion.
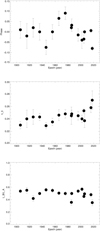 |
Fig. 8. Secular changes of the light-curve parameters. Top panel: phase. Middle panel: disk extinction height scale h0. Lower panel: luminosity ratio of the two components. |
Recently, Zhu (2019) gave an analytic expression for the precession of a disk due to a massive companion (their Eq. (27)). We reconsidered this in the formulation given in Eq. (1) of (Garufi et al. 2019). We assumed a mass of 0.25 M⊙ for the companion on a circular orbit with a radius of 30 au (Mesa et al. 2019), and that the outer radius of the disk is truncated at the 1:2 resonance with this companion. Furthermore, we assumed that the total mass of the primary (sum of the two components) is 5.34 M⊙ (see below) and that the inclination between the disk and the orbital plane of the companion is between 5° and 10° (this last parameter is not critical, however). With these parameters the precession period is of the order of 1500 yr, and the maximum rate of variation in the disk edge inclination is of a few degrees in 100 yr. The interpretation we give of the light curve corresponds to a variation in h0 between 0.23 and 0.26 from 1900 to 2000, which corresponds to a change of ∼2° in the disk inclination. This is fully compatible with the precession scenario.
On the other hand, the luminosity ratio (in the V band) between primary and secondary is quite constant at a value of LB/LA = 0.49 ± 0.07, where the error bar is the rms of values for individual epochs. When we use the relation between mass and V magnitude for pre-main-sequence stars by Pecaut & Mamajek (2013), the mass ratio between the two components is 0.77 ± 0.05. The two components should then have a quite similar effective temperature. Neglecting this possible small difference, we then derived the mass of the two stars that have the same photometric effect as a single star of 3.5 ± 0.5 M⊙, as considered in Sect. 2. We obtain that the two components of the close binary should have masses of MA = 3.02 ± 0.43 M⊙ and MB = 2.32 ± 0.35 M⊙, respectively. The total mass of the binary should then be M = 5.34 ± 0.8 M⊙, and given the period, the semimajor axis of the binary should then be 0.56 au.
As remarked by the referee, our photometric model offers the opportunity of testing the dependence of the absorption of the disk on wavelength using the simultaneous observations in the g′r′i′z′ obtained with REM. The best value for the height scale of the disk h0 is expected to change with wavelength when the extinction significantly depends on wavelength. We found that the same value of h0 well describes data for all the bands we considered above, indicating that the extinction is gray. This in turn suggests that the typical size of the grains within the disk is larger than a few microns. This agrees with the high value of the ratio of the total and selective absorption RV found in Sect. 2.
Finally, we note that according to our model, the disk transmits on average about 45% of the light from the central binary within the V band. This implies AV ∼ 0.9 mag, that is, much less than the total absorption toward R CrA determined in Sect. 2 (AV ∼ 5.47 mag). On the other hand, the secular variation of the luminosity of R CrA, with a variation of about 2.5 mag, is much stronger. This is tentatively attributed to a higher absorption by precession of the outer portion of the disk. Based on the semimajor axis of 27–28 au derived by Mesa et al. (2019), the period of the M-star companion should then be 61 ± 4 yr. This agrees well with the short-term oscillation in phase and h0 values shown in Fig. 7.
6. Information from the SINFONI spectrum
6.1. Emission lines in the spectrum of the M-dwarf companion
A diffraction-limited (0.8 × 0.8″) data set of R CrA was obtained with the SINFONI integral field spectrograph at the ESO VLT (Eisenhauer et al. 2003; Bonnet et al. 2004) on September 11, 2018 (see Mesa et al. 2019). According to our model, this epoch corresponds to phase 0.459, and the spectrum is expected to be dominated by the secondary star. The spectra cover the H band (from 1.45 to 1.85 μm), but we only considered the region between 1.5 and 1.75 μm in our analysis. Figure 9 shows the H-band SINFONI spectra extracted at the locations of the star and of the M-dwarf companion. The wavelengths corresponding to the high-order lines of the Brackett series are also shown. While the stellar spectrum is dominated by the H lines, they are not visible in the spectrum of the companion. We obtained an upper limit of ∼0.2 nm in the equivalent widths (EWs) of these lines. As a comparison, the EWs of the Paschen γ lines in the spectra of stars of similar mass in Orion is ∼0.1 nm (Rigliaco et al. 2012). Because these lines are expected to be weaker than Paschen γ, this result is expected.
 |
Fig. 9. H-band spectra extracted from the SINFONI data for the star (upper panel) and the M-dwarf companion (lower panel). The ticks mark the wavelength corresponding to the H lines. |
6.2. Radial velocities
The radial velocity of R CrA is −36.0 ± 4.9 km s−1 (Gontcharov 2006). However, given the complexity of the system, this is probably not the correct velocity of the center of gravity. Harju et al. (1993) gave a systemic velocity of 5.2 km s−1 for the Coronet cloud with respect to the local standard of rest, meaning a heliocentric value of −2.1 km s−1. This agrees well with the velocity of −2 km s−1 from the interstellar K I lines that are visible in a high-resolution R CrA spectrum acquired on June 5, 2009, with the FEROS spectrograph that we retrieved from the ESO archive. It also agrees with the value of −3 km s−1 for the mean disk velocity estimated from roto-vibrational CO lines (van der Plas et al. 2015). This is therefore very close to the velocity of the center of gravity of the R CrA system, which we assume to be −2 km s−1.
We measured the radial velocity on the spectrum of the star obtained from the SINFONI data (Mesa et al. 2019) using the H lines. We derive a heliocentric velocity VR = +8 ± 3 km s−1, that is, VR = +10 ± 3 km s−1 relative to the center of gravity of the system. The expected radial velocities with respect to the center of gravity of the system at the epoch of the SINFONI observation in the spectrophotometric model considered above are VR = −10 km s−1 for the primary and VR = +13 km s−1 for the secondary because the spectrum is expected to be dominated by the secondary. Our result agrees with the expected velocity.
Using the SINFONI spectrum, we calculated VR = +21 ± 7 km s−1 for the M-dwarf companion found by Mesa et al. (2019), that is, VR = +23 ± 7 km s−1 relative to the center of gravity of the system. This was obtained by cross-correlating the spectrum with that of a dozen template M dwarfs. This value roughly agrees with the value (about VR = +13 km s−1) that is expected for a clockwise motion around the center of gravity (in agreement with indications from astrometry: see Mesa et al. 2019), the near side of the orbit is southwest of the star, and if the total mass of the central binary is 5.34 M⊙, the motion is circular, and the observation was acquired close to quadrature.
7. Conclusions
R CrA, a Herbig AeBe star, is the brightest member of the Coronet association, one of the closest star-forming regions at a distance of about 150 pc. High-contrast imaging revealed that the star is surrounded by a disk seen at high inclination, has a prominent outflow, and an M-dwarf companion at a separation of about 0.2 arcsec (Mesa et al. 2019). The nature of the central object is still not well assessed. In this paper we provide photometric and spectroscopic evidence that the central object might be a binary with almost equal-mass components. As in many other HAeBes, the stellar emission dominates in the optical and UV, while that from the inner part of the disk dominates in the NIR. The fraction of the total luminosity that is reprocessed by the disk is quite similar in objects of this class, which is a consequence of the dusty disk truncation by sublimation and of the flaring extension. They do not change greatly from object to object (see also Lazareff et al. 2017). This allows determining the luminosity of the central star from the emission in the NIR, which can be exploited to derive the main properties of the HAeBe stars. We found that the central object in R CrA is very young (1.5 Myr), quite massive, and highly absorbed (AV = 5.47).
We then examined the light curve of R CrA, for which several data sets are available that extend over more than 120 years. This analysis shows a large secular variation (the star became progressively fainter in the past century) and a periodic modulation with a period of 65.767 ± 0.007 days. This agrees with previous results (Percy et al. 2010). When it is phased at this period, the optical light curve shows an almost symmetric variation with a principal and a secondary maximum, while our new data acquired with the REM telescope show that the luminosity is nearly constant in the NIR (where we essentially see the disk). We interpret this light curve as due to a central binary with two components of MA = 3.02 ± 0.43 M⊙ and MB = 2.32 ± 0.35 M⊙, whose orbit is seen at an angle that grazes the circumbinary disk. In analogy with AGB RVb stars (Waelkens et al. 1991) and the T Tau star KH 15D (Aronow et al. 2018), the variable extinction modulates the light curve. Application of a simple photometric model to the very rich photometric data sets allowed us to show that there is some evolution with time in the model parameters that points toward a progressive increase of the extinction in the past century. We argue that this might be attributed to precession of the outer part of the disk caused by the M-dwarf companion that was recently discovered with high-contrast imaging (Mesa et al. 2019); again, secular luminosity variation related to disk precession makes the case of R CrA similar to that of KH 15D (see Aronow et al. 2018, and references therein). R CrA is then a triple star, with a central quite compact binary composed of two intermediate-mass stars and a total mass of 5.34 ± 0.8 M⊙ with a period of 65.767 ± 0.007 days, and a third component of about 0.25 M⊙ and a period of 61 ± 4 yr.
The R CrA SINFONI data described by Mesa et al. (2019) were acquired at a binary phase of 0.459. The H lines seen in emission in this spectrum can be attributed to the low-mass component of the central binary: the measured radial velocity agrees with this interpretation when an appropriate systemic radial velocity of −2 km s−1 is assumed. The same data set also provides a radial velocity for the M-dwarf companion that agrees with the preliminary orbital solution obtained in Mesa et al. (2019).
Our model for R CrA can further be validated by determining radial velocities and studying line profiles from a sequence of spectra with moderate to high spectral resolution taken along the binary orbit; the expected radial velocity variations are of the order of ±70 km s−1. We note that the spectra of both components are expected be visible in quadrature, when maximum excursion of radial velocities around the mean values are expected. Because lines are quite broad, lines from the two components will be blended and adequate modeling will be required to separate the contribution from the two components. The variation in relative intensity of the emission lines due to the two components is a further test of the model. In addition, shifts of the photocenter of a few milliarseconds are expected as a result of orbital motion: this should be detectable from Gaia observations. This might perhaps be related to the large discrepancy between the parallax given by Gaia DR2 for R CrA and the values obtained for all other members of the Coronet clusters. A detailed study of positions obtained by Gaia at individual epochs would then be welcome as soon as these data are available.
As noted by Mesa et al. (2019), the Gaia DR2 parallax for R CrA is very different from that measured for all other members of the Coronet cluster, for which consistent values were obtained.
Conversely, the value of RV might be determined by comparing the observed colors of the stars with those of suitable templates. As an exercise, we considered the multiband photometry of R CrA by Koen et al. (2010), but for the BVRIC data only because photometry in the U band can be affected by accretion. We then assumed that the colors of the star are the same as those of pre-main-sequence stars with similar Teff (Pecaut & Mamajek 2013). With these assumptions, we find the best agreement between observed and template colors for RV = 4.7, which confirms the value adopted in our analysis. This high value of RV suggests that absorption toward R CrA is due to grains with larger typical sizes than is generally considered for the interstellar medium.
This case also includes a very stable period of 48.37 days that is thought to be the binary period, in addition to a secular brightness evolution of a few magnitudes. However, when it is phased to the binary period, the light curve of KH 15D is quite distinct from that of R CrA, with single broad maxima and minima, rather than unequal peaks as in R CrA. This calls for a different geometry of the system.
This last effect is expected to be shorter than 20 min peak to valley and is therefore negligible in our context.
Acknowledgments
We thank the referee (William Herbst) for useful suggestions that improved the paper. E.S., R.G., D.M., S.D. and V.D. acknowledge support from the “Progetti Premiali” funding scheme of the Italian Ministry of Education, University, and Research. This work has been supported by the project PRIN-INAF 2016 The Cradle of Life – GENESIS-SKA (General Conditions in Early Planetary Systems for the rise of life with SKA). E.R. is supported by the European Union’s Horizon 2020 research and innovation programme under the Marie Skłodowska-Curie grant agreement No. 664931. We acknowledge with thanks the variable star observations from the AAVSO International Database contributed by observers worldwide and used in this research. This paper makes use of data from the first public release of the WASP data (Butters et al. 2010) as provided by the WASP consortium and services at the NASA Exoplanet Archive, which is operated by the California Institute of Technology, under contract with the National Aeronautics and Space Administration under the Exoplanet Exploration Program.
References
- Alcalá, J. M., Spezzi, L., Chapman, N., et al. 2008, ApJ, 676, 427 [NASA ADS] [CrossRef] [Google Scholar]
- Alcalá, J. M., Manara, C. F., Natta, A., et al. 2017, A&A, 600, A20 [NASA ADS] [CrossRef] [EDP Sciences] [Google Scholar]
- Aronow, R. A., Herbst, W., Hughes, A. M., Wilner, D. J., & Winn, J. N. 2018, AJ, 155, 47 [NASA ADS] [CrossRef] [Google Scholar]
- Bellingham, J. G., & Rossano, G. S. 1980, AJ, 85, 555 [NASA ADS] [CrossRef] [Google Scholar]
- Bessell, M. S., & Brett, J. M. 1988, PASP, 100, 1134 [NASA ADS] [CrossRef] [Google Scholar]
- Beuzit, J. L., Vigan, A., Mouillet, D., et al. 2019, A&A, in press, https://doi.org/10.1051/0004-6361/201935251 [Google Scholar]
- Bibo, E. A., The, P. S., & Dawanas, D. N. 1992, A&A, 260, 293 [NASA ADS] [Google Scholar]
- Blondel, P. F. C., & Djie, H. R. E. T. A. 2006, A&A, 456, 1045 [NASA ADS] [CrossRef] [EDP Sciences] [Google Scholar]
- Bonnet, H., Abuter, R., Baker, A., et al. 2004, The Messenger, 117, 17 [NASA ADS] [Google Scholar]
- Butters, O. W., West, R. G., Anderson, D. R., et al. 2010, A&A, 520, L10 [NASA ADS] [CrossRef] [EDP Sciences] [Google Scholar]
- Cardelli, J. A., Clayton, G. C., & Mathis, J. S. 1989, ApJ, 345, 245 [NASA ADS] [CrossRef] [Google Scholar]
- Chauvin, G., Desidera, S., Lagrange, A. M., et al. 2017, in SF2A-2017: Proceedings of the Annual meeting of the French Society of Astronomy and Astrophysics, eds. C. Reylé, P. Di Matteo, F. Herpin, et al., 331 [Google Scholar]
- Chen, H., Grenfell, T. G., Myers, P. C., & Hughes, J. D. 1997, ApJ, 478, 295 [NASA ADS] [CrossRef] [Google Scholar]
- Chen, C. H., Pecaut, M., Mamajek, E. E., Su, K. Y. L., & Bitner, M. 2012, ApJ, 756, 133 [NASA ADS] [CrossRef] [Google Scholar]
- Chincarini, G., Zerbi, F., Antonelli, A., et al. 2003, The Messenger, 113, 40 [NASA ADS] [Google Scholar]
- Cutri, R. M., Skrutskie, M. F., van Dyk, S., et al. 2003, VizieR Online Data Catalog: II/246 [Google Scholar]
- Cutri, R. M., et al. 2013, VizieR Online Data Catalog: II/328 [Google Scholar]
- Ducati, J. R. 2002, VizieR Online Data Catalog: II/237 [Google Scholar]
- Eiroa, C., Oudmaijer, R. D., Davies, J. K., et al. 2002, A&A, 384, 1038 [NASA ADS] [CrossRef] [EDP Sciences] [Google Scholar]
- Eisenhauer, F., Abuter, R., Bickert, K., et al. 2003, in Instrument Design and Performance for Optical/Infrared Ground-based Telescopes, eds. M. Iye, & A. F. M. Moorwood, Proc. SPIE, 4841, 1548 [NASA ADS] [CrossRef] [Google Scholar]
- Fairlamb, J. R., Oudmaijer, R. D., Mendigutía, I., Ilee, J. D., & van den Ancker, M. E. 2015, MNRAS, 453, 976 [NASA ADS] [CrossRef] [Google Scholar]
- Forbrich, J., Preibisch, T., & Menten, K. M. 2006, A&A, 446, 155 [NASA ADS] [CrossRef] [EDP Sciences] [Google Scholar]
- Gaia Collaboration (Brown, A. G. A., et al.) 2018, A&A, 616, A1 [NASA ADS] [CrossRef] [EDP Sciences] [Google Scholar]
- Garufi, A., Podio, L., Bacciotti, F., et al. 2019, A&A, 628, A68 [NASA ADS] [CrossRef] [EDP Sciences] [Google Scholar]
- Gontcharov, G. A. 2006, Astron. Lett., 32, 759 [NASA ADS] [CrossRef] [Google Scholar]
- Gray, R. O., Corbally, C. J., Garrison, R. F., et al. 2006, AJ, 132, 161 [NASA ADS] [CrossRef] [Google Scholar]
- Hamann, F., & Persson, S. E. 1992, ApJS, 82, 285 [NASA ADS] [CrossRef] [Google Scholar]
- Harju, J., Haikala, L. K., Mattila, K., et al. 1993, A&A, 278, 569 [NASA ADS] [Google Scholar]
- Herbig, G. H. 1960, ApJS, 4, 337 [NASA ADS] [CrossRef] [Google Scholar]
- Herbst, W., & Shevchenko, V. S. 1999, AJ, 118, 1043 [NASA ADS] [CrossRef] [Google Scholar]
- Hernández, J., Calvet, N., Briceño, C., Hartmann, L., & Berlind, P. 2004, AJ, 127, 1682 [NASA ADS] [CrossRef] [Google Scholar]
- Hillenbrand, L. A., Strom, S. E., Vrba, F. J., & Keene, J. 1992, ApJ, 397, 613 [NASA ADS] [CrossRef] [Google Scholar]
- Johnson, J. A., Aller, K. M., Howard, A. W., & Crepp, J. R. 2010, PASP, 122, 905 [NASA ADS] [CrossRef] [Google Scholar]
- Kenyon, S. J., & Hartmann, L. 1987, ApJ, 323, 714 [NASA ADS] [CrossRef] [Google Scholar]
- Kochanek, C. S., Shappee, B. J., Stanek, K. Z., et al. 2017, PASP, 129, 104502 [NASA ADS] [CrossRef] [Google Scholar]
- Koen, C., Kilkenny, D., van Wyk, F., & Marang, F. 2010, MNRAS, 403, 1949 [Google Scholar]
- Kraus, S., Hofmann, K.-H., Malbet, F., et al. 2009, A&A, 508, 787 [NASA ADS] [CrossRef] [EDP Sciences] [Google Scholar]
- Lazareff, B., Berger, J.-P., Kluska, J., et al. 2017, A&A, 599, A85 [NASA ADS] [CrossRef] [EDP Sciences] [Google Scholar]
- Manoj, P., & Bhatt, H. C. 2005, A&A, 429, 525 [NASA ADS] [CrossRef] [EDP Sciences] [Google Scholar]
- Marshall, J. P., Moro-Martín, A., Eiroa, C., et al. 2014, A&A, 565, A15 [NASA ADS] [CrossRef] [EDP Sciences] [Google Scholar]
- Meijer, J., Dominik, C., de Koter, A., et al. 2008, A&A, 492, 451 [NASA ADS] [CrossRef] [EDP Sciences] [Google Scholar]
- Merín, B., Montesinos, B., Eiroa, C., et al. 2004, A&A, 419, 301 [NASA ADS] [CrossRef] [EDP Sciences] [Google Scholar]
- Merín, B., Jørgensen, J., Spezzi, L., et al. 2008, ApJS, 177, 551 [NASA ADS] [CrossRef] [Google Scholar]
- Mesa, D., Bonnefoy, M., Gratton, R., et al. 2019, A&A, 624, A4 [NASA ADS] [CrossRef] [EDP Sciences] [Google Scholar]
- Montesinos, B., Eiroa, C., Mora, A., & Merín, B. 2009, A&A, 495, 901 [NASA ADS] [CrossRef] [EDP Sciences] [Google Scholar]
- Neuhäuser, R., & Forbrich, J. 2008, in The Corona Australis Star Forming Region, ed. B. Reipurth, 735 [Google Scholar]
- Nielsen, E. L., De Rosa, R. J., Macintosh, B., et al. 2019, AJ, 158, 13 [NASA ADS] [CrossRef] [Google Scholar]
- Oudmaijer, R. D., Palacios, J., Eiroa, C., et al. 2001, A&A, 379, 564 [NASA ADS] [CrossRef] [EDP Sciences] [Google Scholar]
- Pecaut, M. J., & Mamajek, E. E. 2013, ApJS, 208, 9 [NASA ADS] [CrossRef] [Google Scholar]
- Percy, J. R., Grynko, S., Seneviratne, R., & Herbst, W. 2010, PASP, 122, 753 [NASA ADS] [CrossRef] [Google Scholar]
- Perez, M. R., & Grady, C. A. 1997, Space Sci. Rev., 82, 407 [NASA ADS] [CrossRef] [Google Scholar]
- Pojmanski, G. 1997, Acta Astron., 47, 467 [NASA ADS] [Google Scholar]
- Rigliaco, E., Natta, A., Testi, L., et al. 2012, A&A, 548, A56 [NASA ADS] [CrossRef] [EDP Sciences] [Google Scholar]
- Shappee, B. J., Prieto, J. L., Grupe, D., et al. 2014, ApJ, 788, 48 [NASA ADS] [CrossRef] [Google Scholar]
- Skrutskie, M. F., Cutri, R. M., Stiening, R., et al. 2006, AJ, 131, 1163 [NASA ADS] [CrossRef] [Google Scholar]
- Takami, M., Bailey, J., & Chrysostomou, A. 2003, A&A, 397, 675 [NASA ADS] [CrossRef] [EDP Sciences] [Google Scholar]
- The, P. S. 1994, in The Nature and Evolutionary Status of Herbig Ae/Be Stars, eds. P. S. The, M. R. Perez, & E. P. J. van den Heuvel, ASP Conf. Ser., 62, 23 [NASA ADS] [Google Scholar]
- Tognelli, E., Prada Moroni, P. G., & Degl’Innocenti, S. 2011, A&A, 533, A109 [NASA ADS] [CrossRef] [EDP Sciences] [Google Scholar]
- van der Plas, G., van den Ancker, M. E., Waters, L. B. F. M., & Dominik, C. 2015, A&A, 574, A75 [NASA ADS] [CrossRef] [EDP Sciences] [Google Scholar]
- Vioque, M., Oudmaijer, R. D., Baines, D., Mendigutía, I., & Pérez-Martínez, R. 2018, A&A, 620, A128 [NASA ADS] [CrossRef] [EDP Sciences] [Google Scholar]
- Waelkens, C., Lamers, H. J. G. L. M., Waters, L. B. F. M., et al. 1991, A&A, 242, 433 [Google Scholar]
- Waelkens, C., Van Winckel, H., Waters, L. B. F. M., & Bakker, E. J. 1996, A&A, 314, L17 [NASA ADS] [Google Scholar]
- Zechmeister, M., & Kürster, M. 2009, A&A, 496, 577 [NASA ADS] [CrossRef] [EDP Sciences] [Google Scholar]
- Zhu, Z. 2019, MNRAS, 483, 4221 [NASA ADS] [CrossRef] [Google Scholar]
Appendix A: Model fit to the photometric curves
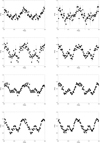 |
Fig. A.1. Phased curves from various data sets. From left to right and top to bottom: AAVSO data from 1896 to 1916, AAVSO data from 1906 to 1926, AAVSO data from 1916 to 1936, AAVSO data from 1926 to 1946, AAVSO data from 1936 to 1956, AAVSO data from 1946 to 1966, AAVSO data from 1956 to 1976, and AAVSO data from 1966 to 1986. We also plot the best-fit model light curves. |
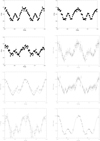 |
Fig. A.2. Phased curves from various data sets. From left to right and top to bottom: AAVSO data from 1976 to 1996, AAVSO data from 1986 to 2006, AAVSO data from 1996 to 2006, ASAS data, ASAS-SN data, SuperWasp data, Herbst data, and REM data. We also plot the best-fit model light curves. |
All Tables
All Figures
|
Fig. 1. Comparison between the absolute magnitude in the V band and in the W2 band for samples of Herbig Ae-Be stars from Hamann & Persson (1992) (filled circles) and Vioque et al. (2018) (open circles); neither of them are corrected for absorption. The solid line is the relation MV = MW2 + 4.45 that we assume to be representative of unreddened objects. |
| In the text | |
|
Fig. 2. Comparison between absolute magnitude MV obtained from W2 and from the correction for absorption for a sample of Herbig Ae-Be stars. The solid line represents equality between the two determinations. |
| In the text | |
|
Fig. 3. Comparison between the values derived in this paper and those from Vioque et al. (2018). Upper left panel: absorption in the V band AV. Upper right panel: mass. Lower panel: age. The solid line represents identity. |
| In the text | |
|
Fig. 4. Secular variation of AVVSO photometric measurements. Median values for each year are shown. |
| In the text | |
|
Fig. 5. Top panel: generalized Lomb–Scargle periodogram for the whole series of AAVSO photometric data for R CrA after subtracting the median for each year. Bottom panel: light curve phased at the peak of the periodogram (65.767 days). Points are the average for each phase bin, and error bars are the standard deviation of the mean. |
| In the text | |
|
Fig. 6. Top: photometric variation of R CrA from REM images. Bottom: same as in the top panel, but phased to the 65.767-day period according to the AAVSO sequence (black). For better visualization, we applied an offset to the zero-point of each sequence. |
| In the text | |
|
Fig. 7. Schematic view of the extinction model for R CrA. The white and green ellipses represent the apparent orbits of the two components in the plane of the sky. The reddish region represents the area covered by the near side of the disk. When one of the two components is in this region, its light is attenuated by the dust in the disk. |
| In the text | |
|
Fig. 8. Secular changes of the light-curve parameters. Top panel: phase. Middle panel: disk extinction height scale h0. Lower panel: luminosity ratio of the two components. |
| In the text | |
|
Fig. 9. H-band spectra extracted from the SINFONI data for the star (upper panel) and the M-dwarf companion (lower panel). The ticks mark the wavelength corresponding to the H lines. |
| In the text | |
|
Fig. A.1. Phased curves from various data sets. From left to right and top to bottom: AAVSO data from 1896 to 1916, AAVSO data from 1906 to 1926, AAVSO data from 1916 to 1936, AAVSO data from 1926 to 1946, AAVSO data from 1936 to 1956, AAVSO data from 1946 to 1966, AAVSO data from 1956 to 1976, and AAVSO data from 1966 to 1986. We also plot the best-fit model light curves. |
| In the text | |
|
Fig. A.2. Phased curves from various data sets. From left to right and top to bottom: AAVSO data from 1976 to 1996, AAVSO data from 1986 to 2006, AAVSO data from 1996 to 2006, ASAS data, ASAS-SN data, SuperWasp data, Herbst data, and REM data. We also plot the best-fit model light curves. |
| In the text | |
Current usage metrics show cumulative count of Article Views (full-text article views including HTML views, PDF and ePub downloads, according to the available data) and Abstracts Views on Vision4Press platform.
Data correspond to usage on the plateform after 2015. The current usage metrics is available 48-96 hours after online publication and is updated daily on week days.
Initial download of the metrics may take a while.