Free Access
Fig. 5.
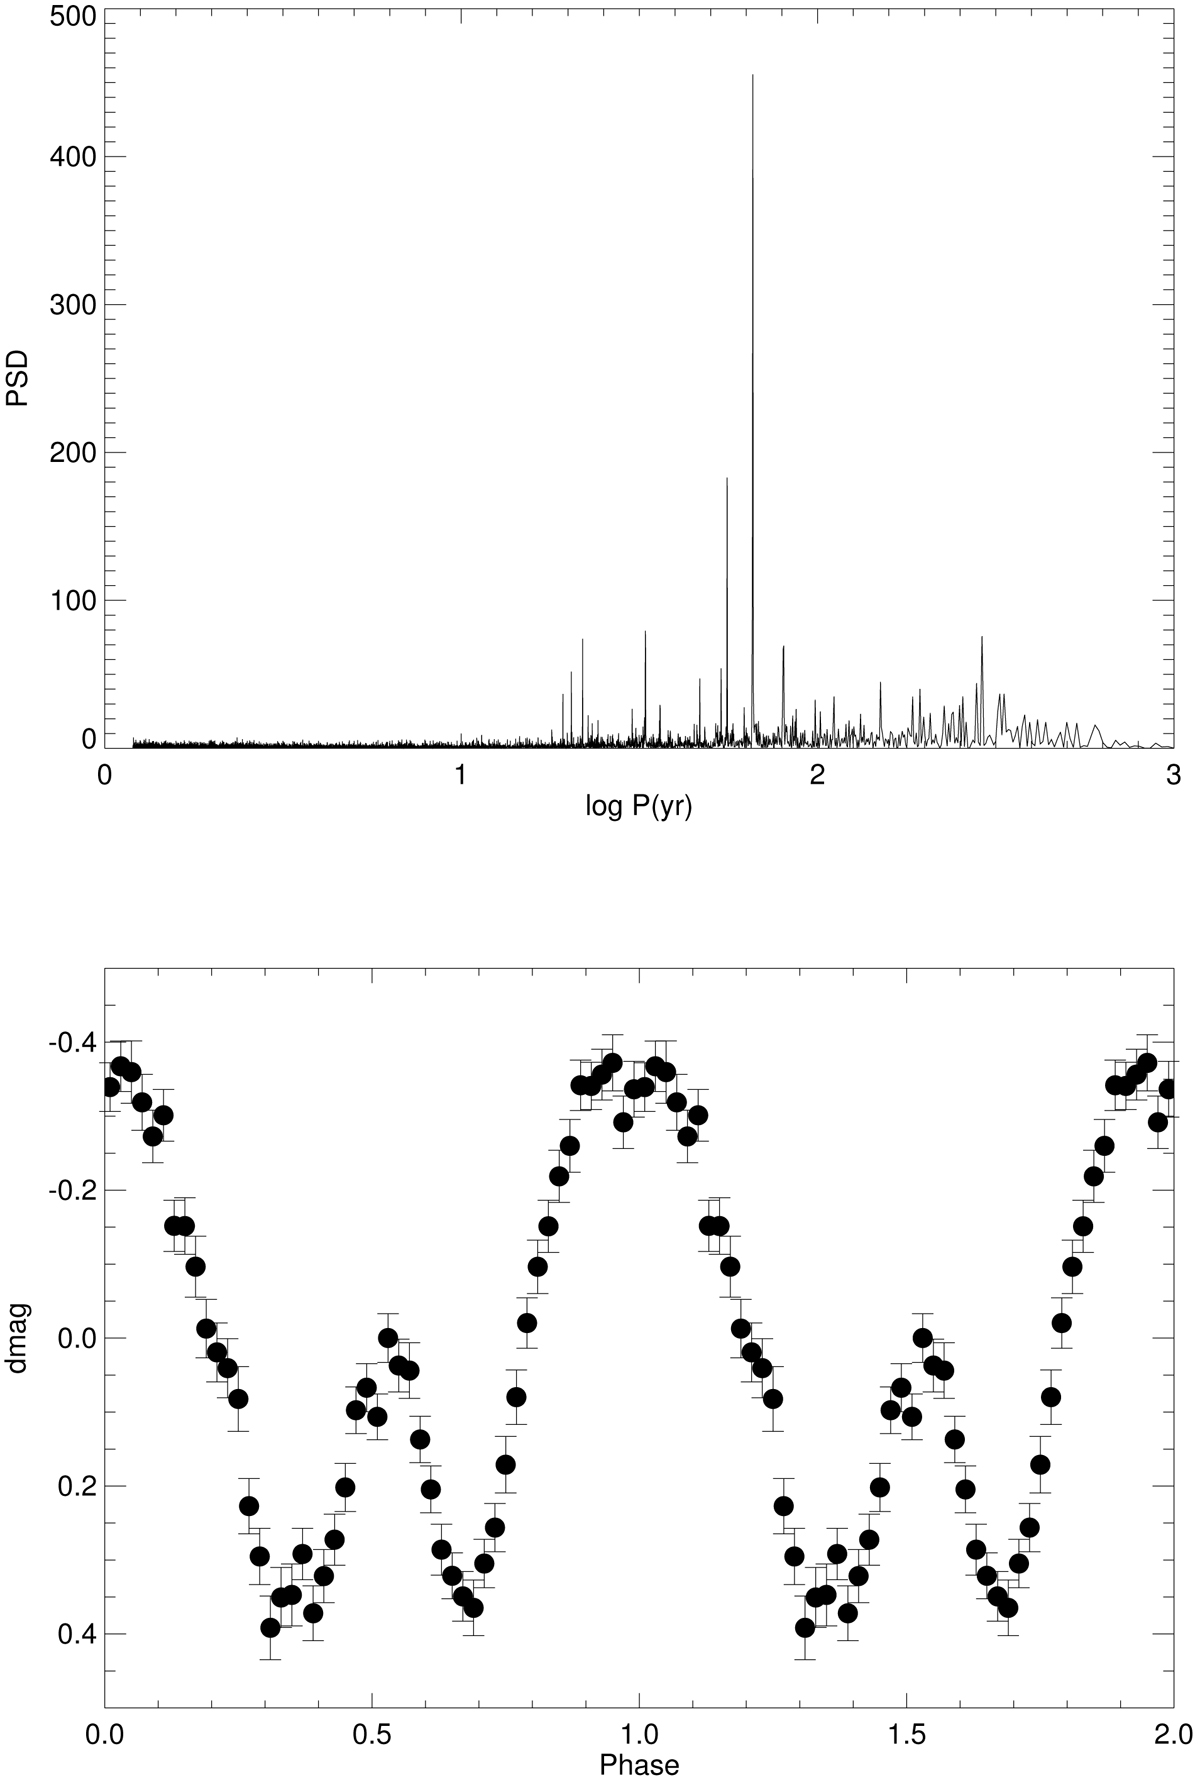
Top panel: generalized Lomb–Scargle periodogram for the whole series of AAVSO photometric data for R CrA after subtracting the median for each year. Bottom panel: light curve phased at the peak of the periodogram (65.767 days). Points are the average for each phase bin, and error bars are the standard deviation of the mean.
Current usage metrics show cumulative count of Article Views (full-text article views including HTML views, PDF and ePub downloads, according to the available data) and Abstracts Views on Vision4Press platform.
Data correspond to usage on the plateform after 2015. The current usage metrics is available 48-96 hours after online publication and is updated daily on week days.
Initial download of the metrics may take a while.