Fig. 7.
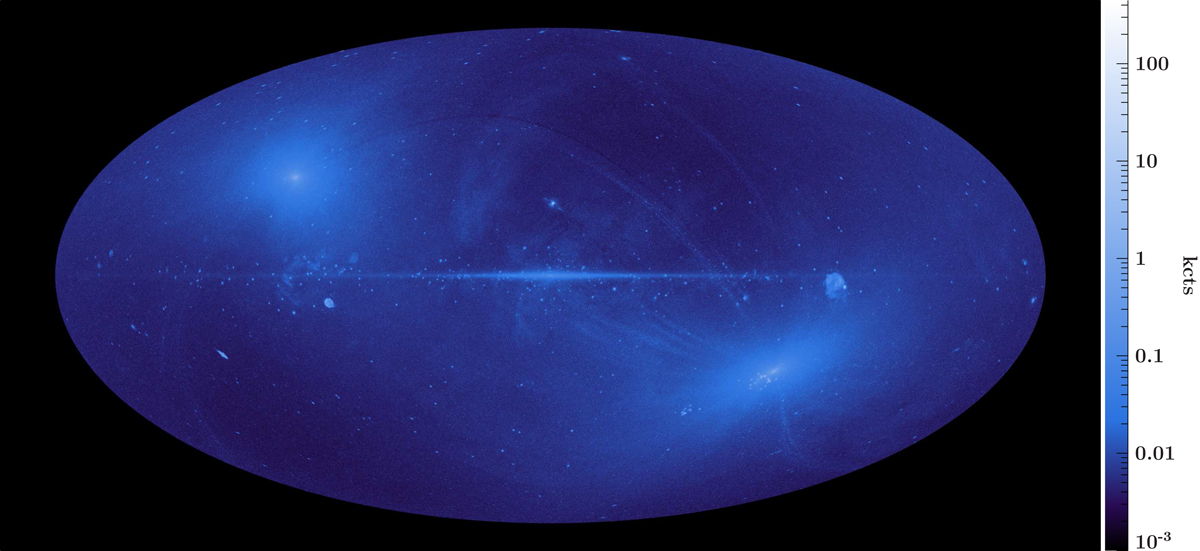
All-sky simulation with the full eROSITA setup for a half-year survey. Details on the simulated sources can be found in the text. Faint stripes are artifacts from the slightly inhomogeneous sampling of the extended ROSAT emission included in the simulation. We note that more counts are simulated at the poles, as the survey has a much larger exposure there and not due to differences in the sky brightness in these areas.
Current usage metrics show cumulative count of Article Views (full-text article views including HTML views, PDF and ePub downloads, according to the available data) and Abstracts Views on Vision4Press platform.
Data correspond to usage on the plateform after 2015. The current usage metrics is available 48-96 hours after online publication and is updated daily on week days.
Initial download of the metrics may take a while.