Fig. 11.
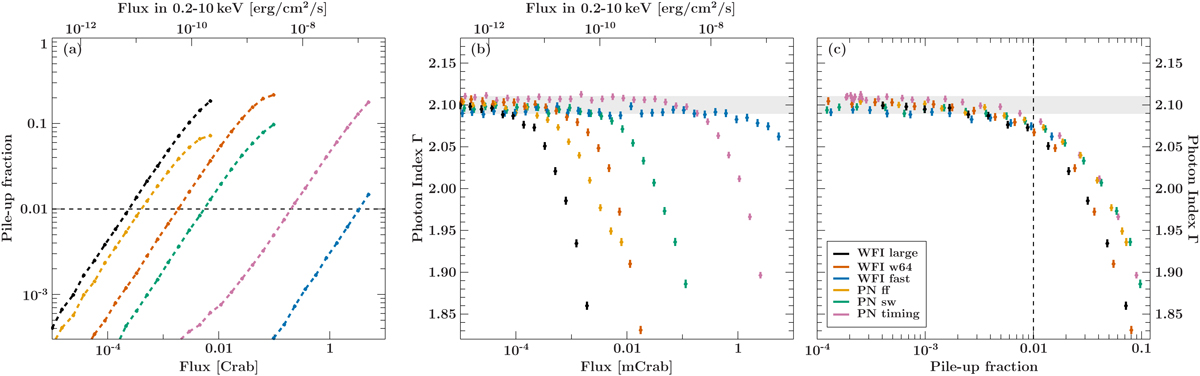
Simulation of a Crab-like spectrum with the EPIC pn detector on XMM-Newton and the planned Athena-WFI instrument for a selection of read-out modes with different qualification to study bright sources. Panel a: fraction of piled up events in all detected events for increasing source flux. Panel b: index of a power law fit to the simulated spectra, showing the effect of spectral distortion with increasing source flux depending on the detector and read-out mode. Panel c: obtained power-law index plotted for the determined pile-up fraction, revealing a similar and generic behavior, largely independent of the detector.
Current usage metrics show cumulative count of Article Views (full-text article views including HTML views, PDF and ePub downloads, according to the available data) and Abstracts Views on Vision4Press platform.
Data correspond to usage on the plateform after 2015. The current usage metrics is available 48-96 hours after online publication and is updated daily on week days.
Initial download of the metrics may take a while.