Free Access
Fig. 7.
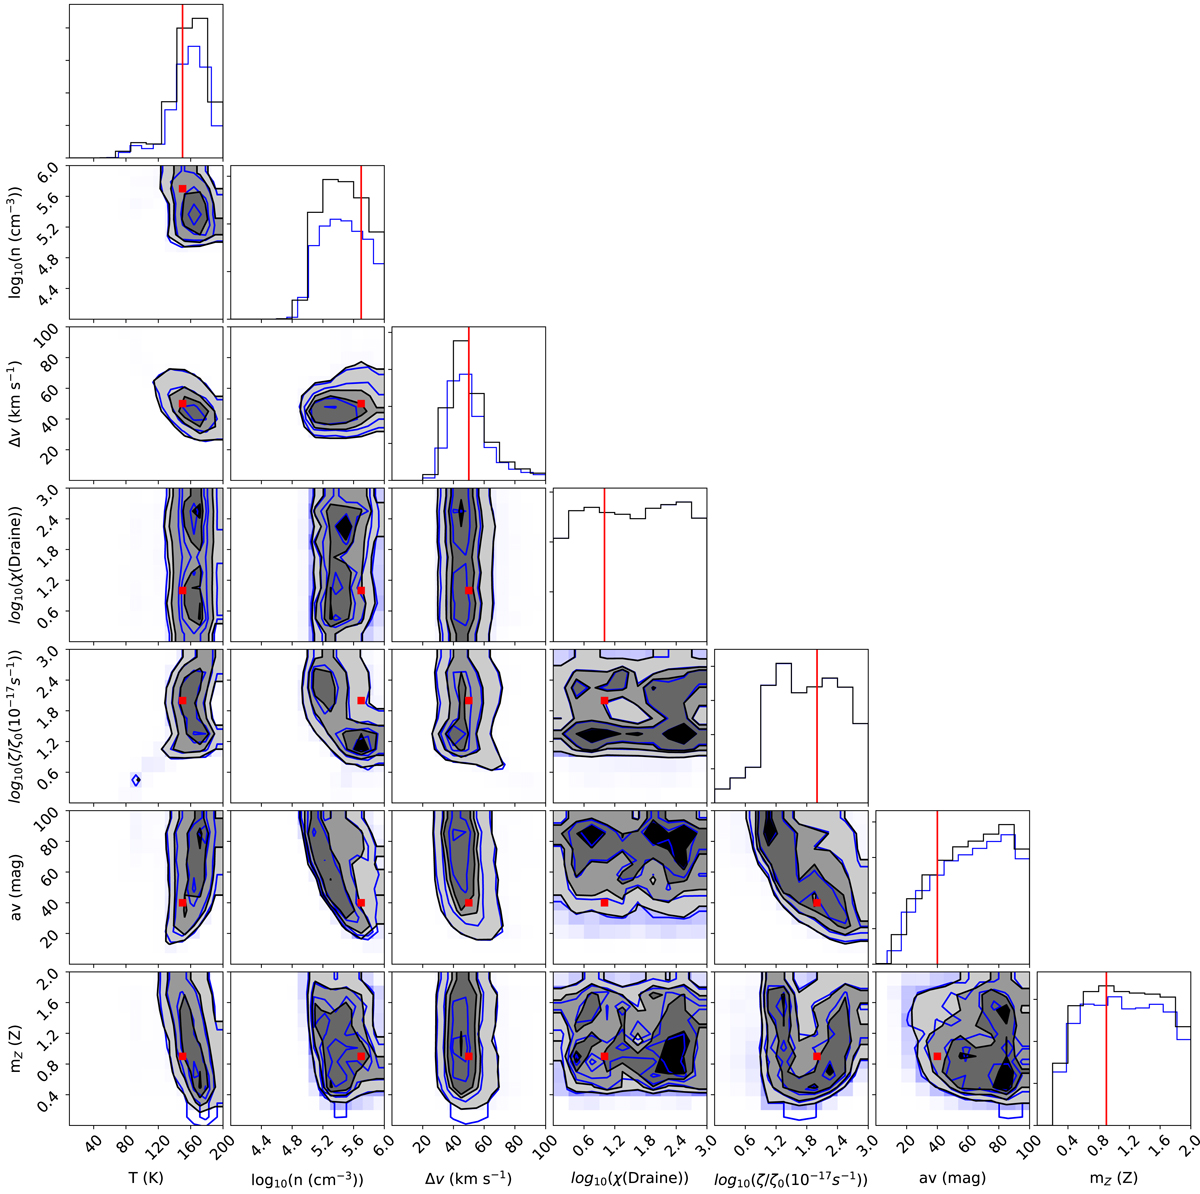
Marginalized posterior distributions obtained when using a single-phase chemistry dependent forward model. The posterior distributions obtained using the emulators are plotted in black while those obtained using the nonemulated models are plotted in blue. The true parameters, plotted in red, can be found in Table 3.
Current usage metrics show cumulative count of Article Views (full-text article views including HTML views, PDF and ePub downloads, according to the available data) and Abstracts Views on Vision4Press platform.
Data correspond to usage on the plateform after 2015. The current usage metrics is available 48-96 hours after online publication and is updated daily on week days.
Initial download of the metrics may take a while.