Fig. 3.
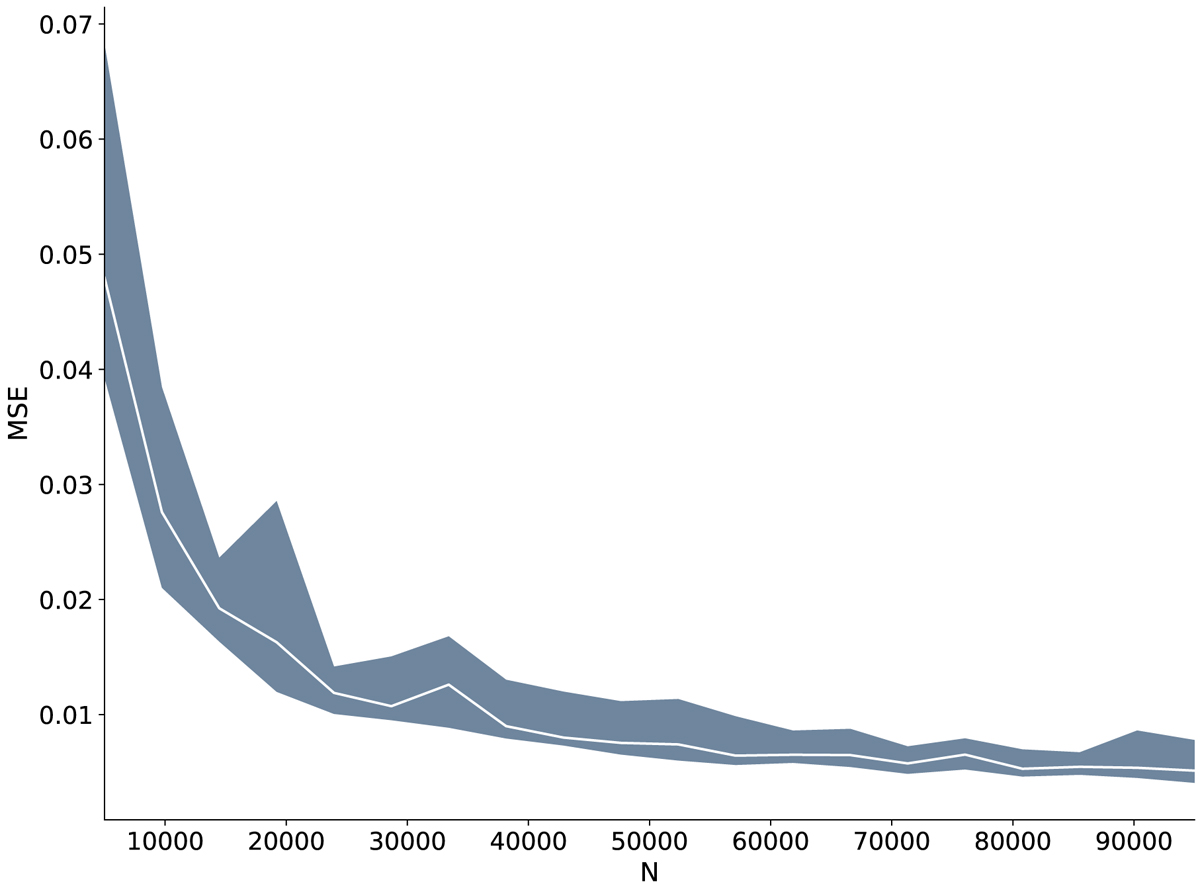
Effect of training set size on emulator prediction. The y-axis shows the mean squared error between the log10 ground truth abundances and neural network prediction evaluated on the validation dataset. The x-axis shows the size of the training dataset. The shaded area represents the spread of mean squared error obtained across runs; the 68.2% percentiles centered around the mean are shaded.
Current usage metrics show cumulative count of Article Views (full-text article views including HTML views, PDF and ePub downloads, according to the available data) and Abstracts Views on Vision4Press platform.
Data correspond to usage on the plateform after 2015. The current usage metrics is available 48-96 hours after online publication and is updated daily on week days.
Initial download of the metrics may take a while.